29
/de/
de
AIzaSyAYiBZKx7MnpbEhh9jyipgxe19OcubqV5w
April 1, 2024
276614
United States
USA
true
2
1
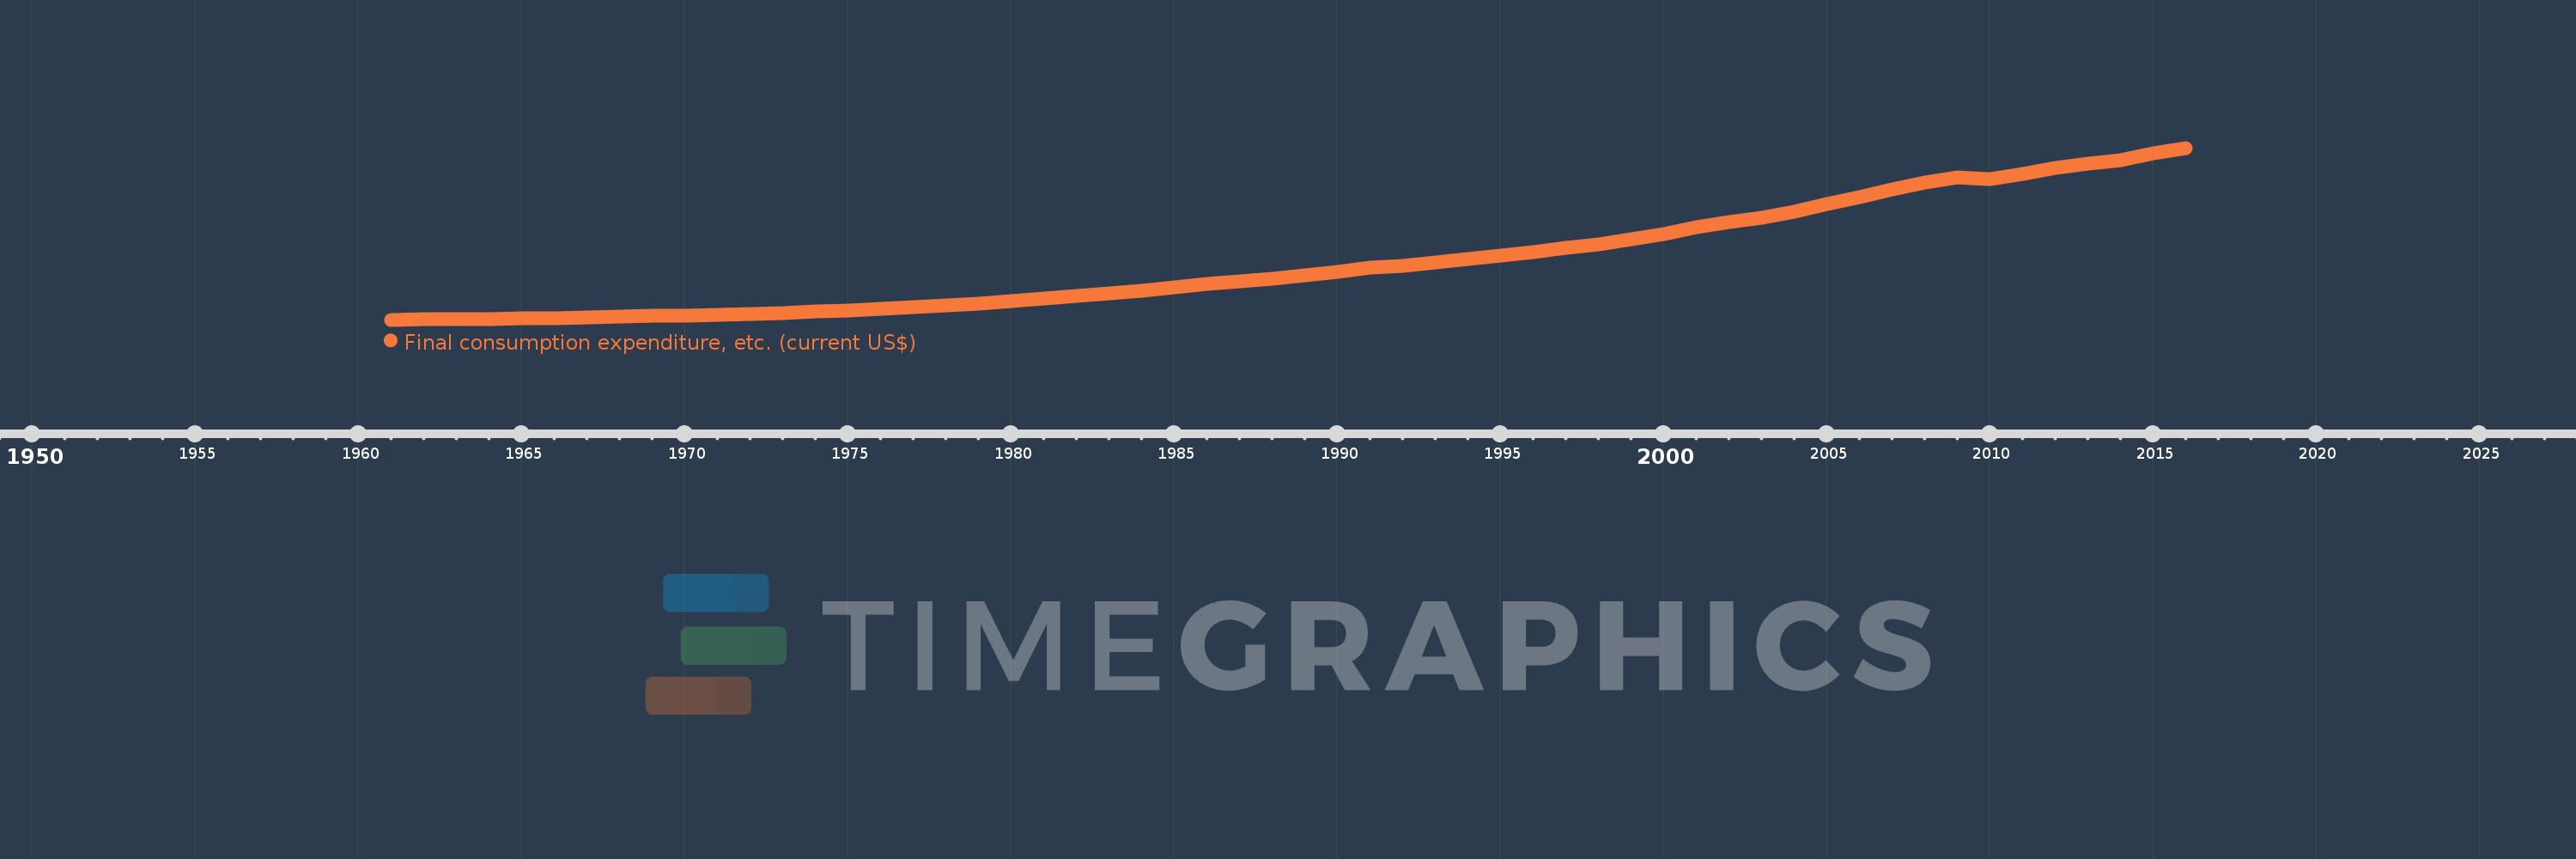
Final consumption expenditure, etc. (current US$)
2016,2015,2014,2013,2012,2011,2010,2009,2008,2007,2006,2005,2004,2003,2002,2001,2000,1999,1998,1997,1996,1995,1994,1993,1992,1991,1990,1989,1988,1987,1986,1985,1984,1983,1982,1981,1980,1979,1978,1977,1976,1975,1974,1973,1972,1971,1970,1969,1968,1967,1966,1965,1964,1963,1962,1961
Diese Statistik in anderen Ländern:
AfghanistanAlbaniaAlgeriaAngolaAntigua and BarbudaArab WorldArgentinaArmeniaArubaAustraliaAustriaAzerbaijanBahamas, TheBahrainBangladeshBarbadosBelarusBelgiumBelizeBeninBermudaBhutanBoliviaBosnia and HerzegovinaBotswanaBrazilBrunei DarussalamBulgariaBurkina FasoBurundiCabo VerdeCambodiaCameroonCanadaCaribbean small statesCentral African RepublicCentral Europe and the BalticsChadChileChinaColombiaComorosCongo, Dem. Rep.Congo, Rep.Costa RicaCote d'IvoireCroatiaCubaCyprusCzech RepublicDenmarkDjiboutiDominicaDominican RepublicEarly-demographic dividendEast Asia & PacificEast Asia & Pacific (excluding high income)East Asia & Pacific (IDA & IBRD countries)EcuadorEgypt, Arab Rep.El SalvadorEquatorial GuineaEritreaEstoniaEthiopiaEuro areaEurope & Central AsiaEurope & Central Asia (excluding high income)Europe & Central Asia (IDA & IBRD countries)European UnionFaroe IslandsFijiFinlandFragile and conflict affected situationsFranceGabonGambia, TheGeorgiaGermanyGhanaGreeceGrenadaGuatemalaGuineaGuinea-BissauGuyanaHaitiHeavily indebted poor countries (HIPC)High incomeHondurasHong Kong SAR, ChinaHungaryIBRD onlyIcelandIDA & IBRD totalIDA blendIDA onlyIDA totalIndiaIndonesiaIran, Islamic Rep.IraqIrelandIsraelItalyJamaicaJapanJordanKazakhstanKenyaKiribatiKorea, Rep.KosovoKuwaitKyrgyz RepublicLao PDRLate-demographic dividendLatin America & Caribbean Latin America & Caribbean (excluding high income)Latin America & the Caribbean (IDA & IBRD countries)LatviaLeast developed countries: UN classificationLebanonLesothoLiberiaLibyaLithuaniaLow & middle incomeLow incomeLower middle incomeLuxembourgMacao SAR, ChinaMacedonia, FYRMadagascarMalawiMalaysiaMaldivesMaliMaltaMauritaniaMauritiusMexicoMicronesia, Fed. Sts.Middle East & North AfricaMiddle East & North Africa (excluding high income)Middle East & North Africa (IDA & IBRD countries)Middle incomeMoldovaMongoliaMontenegroMoroccoMozambiqueNamibiaNepalNetherlandsNew CaledoniaNew ZealandNicaraguaNigerNigeriaNorth AmericaNorwayOECD membersOmanOther small statesPakistanPanamaPapua New GuineaParaguayPeruPhilippinesPolandPortugalPost-demographic dividendPre-demographic dividendPuerto RicoQatarRomaniaRussian FederationRwandaSaudi ArabiaSenegalSerbiaSeychellesSierra LeoneSingaporeSlovak RepublicSloveniaSmall statesSolomon IslandsSouth AfricaSouth AsiaSouth Asia (IDA & IBRD)South SudanSpainSri LankaSt. Kitts and NevisSt. LuciaSt. Vincent and the GrenadinesSub-Saharan Africa Sub-Saharan Africa (excluding high income)Sub-Saharan Africa (IDA & IBRD countries)SudanSurinameSwazilandSwedenSwitzerlandSyrian Arab RepublicTajikistanTanzaniaThailandTimor-LesteTogoTongaTrinidad and TobagoTunisiaTurkeyTurkmenistanUgandaUkraineUnited Arab EmiratesUnited KingdomUnited StatesUpper middle incomeUruguayUzbekistanVanuatuVenezuela, RBVietnamWest Bank and GazaWorldYemen, Rep.ZambiaZimbabwe Zeitlinie:
Diese Zeitleiste vorliegt die Graphik ab 1961 J. bis 2016 J. United States. Die Angaben bis 1960 J. sind nicht vorhanden. Die Zahl aktueller Beobachtungen nach Daten: 56.
Die Quelle (Bezeichnung):
Kennzahlen der Weltentwicklung
Die Quelle (Einrichtung):
World Bank national accounts data, and OECD National Accounts data files.
Kategorien:
Economy & Growth
Es wurde aktualisiert:
23 Apr 2017 Jahr
Kennzahlen der Wertänderungen vom Jahr zum Jahr
im Durchschnitt:
5.347 Trln
Minimum:
416.7 Mlrd.
1 Jan 1961 Jahr
Maximum:
14.889 Trln
1 Jan 2016 Jahr
Zum Datum der Beobachtung
Wert
Absolute Veränderung
Die Veränderung bezüglich dem vorherigen Wert
1 Jan 1961 Jahr
416.7 Mlrd.
+416.7 Mlrd.
0.0%
1 Jan 1962 Jahr
431.8 Mlrd.
+15.1 Mlrd.
3.62%
1 Jan 1963 Jahr
461.4 Mlrd.
+29.6 Mlrd.
6.86%
1 Jan 1964 Jahr
485.8 Mlrd.
+24.4 Mlrd.
5.29%
1 Jan 1965 Jahr
520.4 Mlrd.
+34.6 Mlrd.
7.12%
1 Jan 1966 Jahr
560.6 Mlrd.
+40.2 Mlrd.
7.72%
1 Jan 1967 Jahr
613.4 Mlrd.
+52.8 Mlrd.
9.42%
1 Jan 1968 Jahr
657.8 Mlrd.
+44.4 Mlrd.
7.24%
1 Jan 1969 Jahr
725.0 Mlrd.
+67.2 Mlrd.
10.22%
1 Jan 1970 Jahr
776.1 Mlrd.
+51.1 Mlrd.
7.05%
1 Jan 1971 Jahr
842.092 Mlrd.
+65.992 Mlrd.
8.5%
1 Jan 1972 Jahr
911.815 Mlrd.
+69.723 Mlrd.
8.28%
1 Jan 1973 Jahr
996.99 Mlrd.
+85.175 Mlrd.
9.34%
1 Jan 1974 Jahr
1.092 Trln
+94.882 Mlrd.
9.52%
1 Jan 1975 Jahr
1.199 Trln
+107.077 Mlrd.
9.81%
1 Jan 1976 Jahr
1.331 Trln
+132.346 Mlrd.
11.04%
1 Jan 1977 Jahr
1.466 Trln
+135.058 Mlrd.
10.14%
1 Jan 1978 Jahr
1.619 Trln
+152.92 Mlrd.
10.43%
1 Jan 1979 Jahr
1.798 Trln
+178.72 Mlrd.
11.04%
1 Jan 1980 Jahr
1.995 Trln
+196.939 Mlrd.
10.95%
1 Jan 1981 Jahr
2.21 Trln
+214.578 Mlrd.
10.76%
1 Jan 1982 Jahr
2.445 Trln
+235.391 Mlrd.
10.65%
1 Jan 1983 Jahr
2.627 Trln
+182.081 Mlrd.
7.45%
1 Jan 1984 Jahr
2.881 Trln
+254.114 Mlrd.
9.67%
1 Jan 1985 Jahr
3.13 Trln
+249.053 Mlrd.
8.64%
1 Jan 1986 Jahr
3.411 Trln
+281.082 Mlrd.
8.98%
1 Jan 1987 Jahr
3.635 Trln
+223.561 Mlrd.
6.55%
1 Jan 1988 Jahr
3.868 Trln
+233.378 Mlrd.
6.42%
1 Jan 1989 Jahr
4.167 Trln
+298.492 Mlrd.
7.72%
1 Jan 1990 Jahr
4.474 Trln
+307.639 Mlrd.
7.38%
1 Jan 1991 Jahr
4.774 Trln
+299.325 Mlrd.
6.69%
1 Jan 1992 Jahr
4.964 Trln
+190.596 Mlrd.
3.99%
1 Jan 1993 Jahr
5.265 Trln
+300.689 Mlrd.
6.06%
1 Jan 1994 Jahr
5.545 Trln
+280.269 Mlrd.
5.32%
1 Jan 1995 Jahr
5.851 Trln
+305.406 Mlrd.
5.51%
1 Jan 1996 Jahr
6.129 Trln
+278.069 Mlrd.
4.75%
1 Jan 1997 Jahr
6.445 Trln
+315.912 Mlrd.
5.15%
1 Jan 1998 Jahr
6.785 Trln
+340.791 Mlrd.
5.29%
1 Jan 1999 Jahr
7.175 Trln
+389.79 Mlrd.
5.74%
1 Jan 2000 Jahr
7.665 Trln
+489.448 Mlrd.
6.82%
1 Jan 2001 Jahr
8.237 Trln
+571.967 Mlrd.
7.46%
1 Jan 2002 Jahr
8.648 Trln
+411.674 Mlrd.
5.0%
1 Jan 2003 Jahr
9.035 Trln
+387.176 Mlrd.
4.48%
1 Jan 2004 Jahr
9.521 Trln
+485.705 Mlrd.
5.38%
1 Jan 2005 Jahr
10.129 Trln
+607.841 Mlrd.
6.38%
1 Jan 2006 Jahr
10.774 Trln
+645.203 Mlrd.
6.37%
1 Jan 2007 Jahr
11.394 Trln
+619.677 Mlrd.
5.75%
1 Jan 2008 Jahr
11.96 Trln
+566.391 Mlrd.
4.97%
1 Jan 2009 Jahr
12.382 Trln
+421.979 Mlrd.
3.53%
1 Jan 2010 Jahr
12.289 Trln
-93.178 Mlrd.
-0.75%
1 Jan 2011 Jahr
12.724 Trln
+435.362 Mlrd.
3.54%
1 Jan 2012 Jahr
13.22 Trln
+495.767 Mlrd.
3.9%
1 Jan 2013 Jahr
13.595 Trln
+374.618 Mlrd.
2.83%
1 Jan 2014 Jahr
13.885 Trln
+290.124 Mlrd.
2.13%
1 Jan 2015 Jahr
14.421 Trln
+536.018 Mlrd.
3.86%
1 Jan 2016 Jahr
14.889 Trln
+467.674 Mlrd.
3.24%
Bewertung der Länder gemäß mit laufender Statistik nach Jahren


Kommentare: