29
/de/
de
AIzaSyAYiBZKx7MnpbEhh9jyipgxe19OcubqV5w
April 1, 2024
275371
United Kingdom
GBR
true
2
1
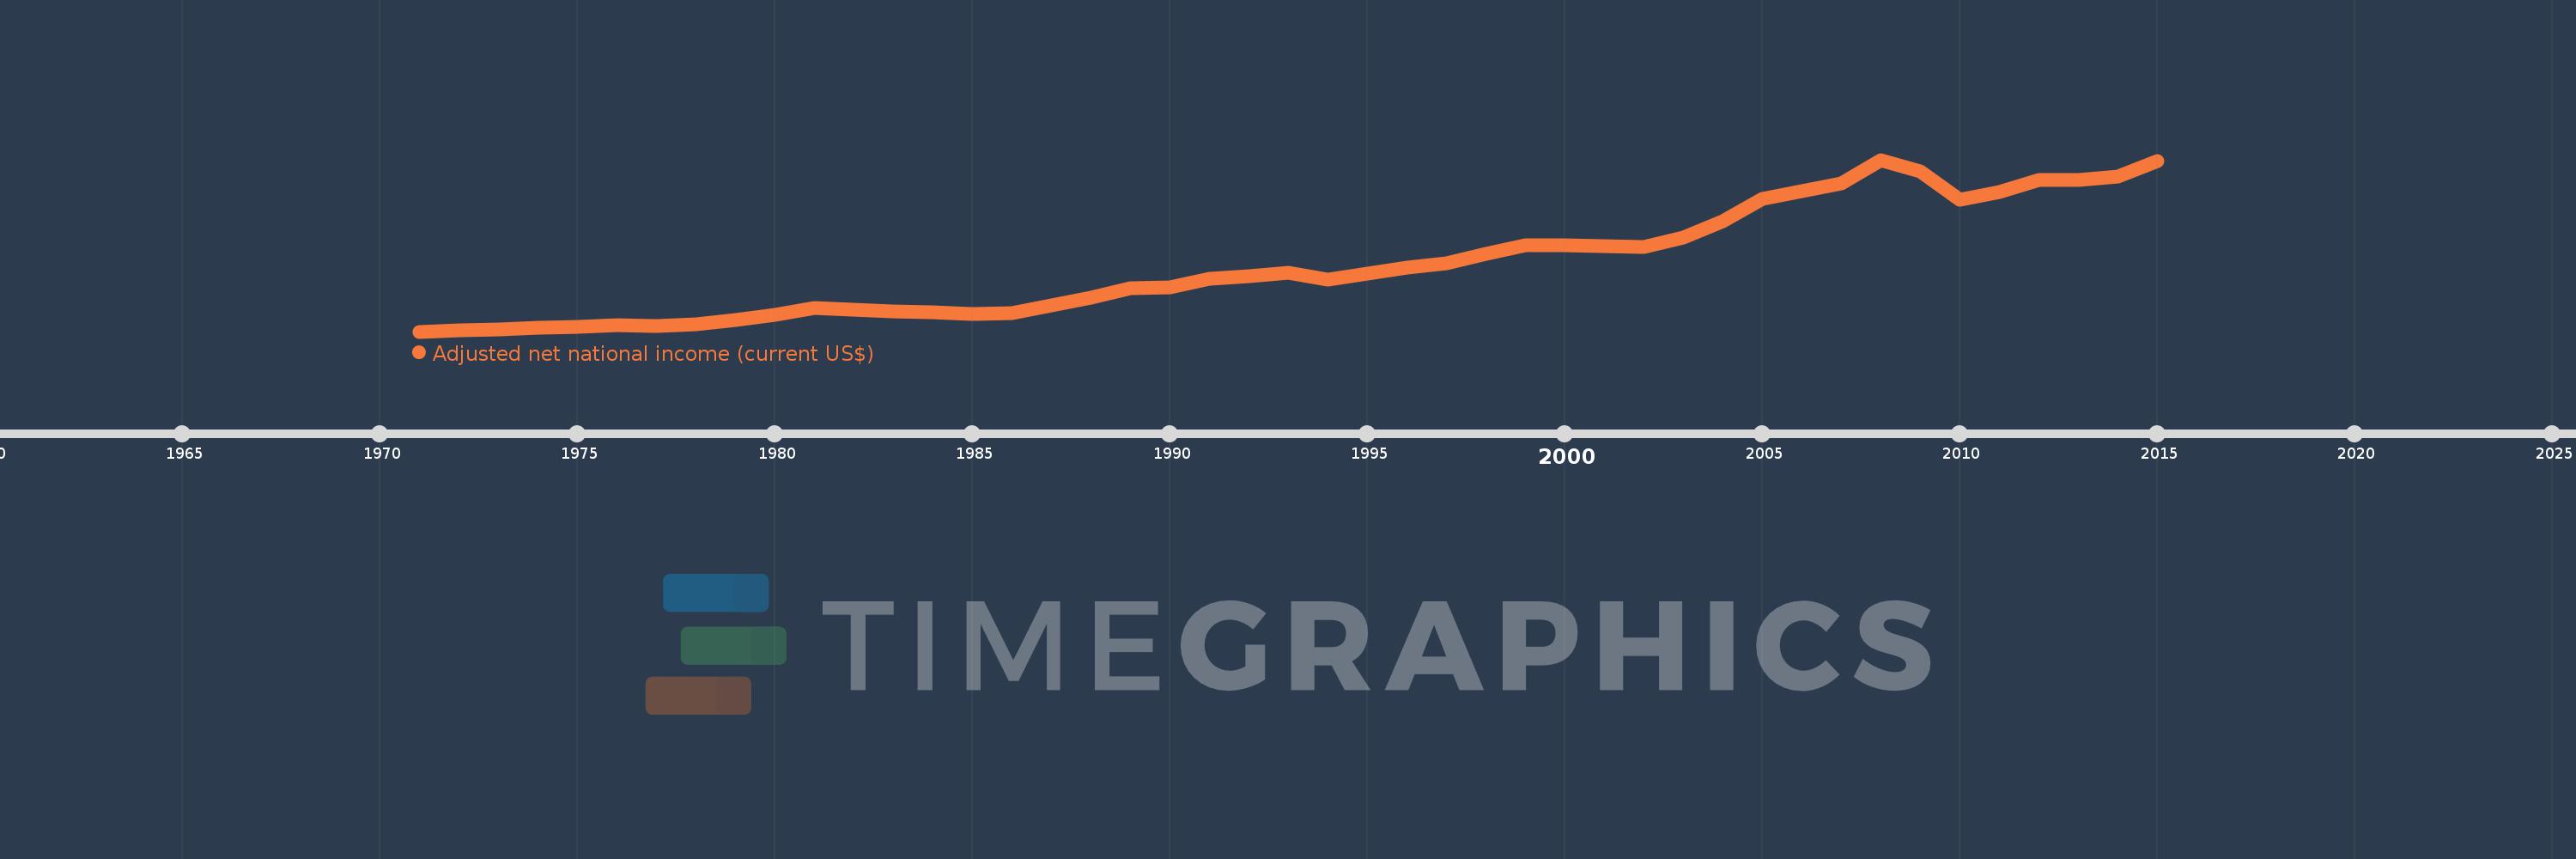
Adjusted net national income (current US$)
2015,2014,2013,2012,2011,2010,2009,2008,2007,2006,2005,2004,2003,2002,2001,2000,1999,1998,1997,1996,1995,1994,1993,1992,1991,1990,1989,1988,1987,1986,1985,1984,1983,1982,1981,1980,1979,1978,1977,1976,1975,1974,1973,1972,1971
Diese Statistik in anderen Ländern:
AfghanistanAlbaniaAlgeriaAngolaArab WorldArgentinaArmeniaAustraliaAustriaAzerbaijanBahamas, TheBahrainBangladeshBarbadosBelarusBelgiumBelizeBeninBhutanBoliviaBotswanaBrazilBrunei DarussalamBulgariaBurkina FasoBurundiCabo VerdeCambodiaCameroonCanadaCaribbean small statesCentral African RepublicCentral Europe and the BalticsChadChileChinaColombiaComorosCongo, Dem. Rep.Congo, Rep.Costa RicaCote d'IvoireCroatiaCubaCyprusCzech RepublicDenmarkDjiboutiDominicaDominican RepublicEarly-demographic dividendEast Asia & PacificEast Asia & Pacific (excluding high income)East Asia & Pacific (IDA & IBRD countries)EcuadorEgypt, Arab Rep.El SalvadorEquatorial GuineaEritreaEstoniaEthiopiaEuro areaEurope & Central AsiaEurope & Central Asia (excluding high income)Europe & Central Asia (IDA & IBRD countries)European UnionFijiFinlandFragile and conflict affected situationsFranceGabonGambia, TheGeorgiaGermanyGhanaGreeceGuatemalaGuineaGuinea-BissauGuyanaHaitiHeavily indebted poor countries (HIPC)High incomeHondurasHong Kong SAR, ChinaHungaryIBRD onlyIcelandIDA & IBRD totalIDA blendIDA onlyIDA totalIndiaIndonesiaIran, Islamic Rep.IraqIrelandIsraelItalyJamaicaJapanJordanKazakhstanKenyaKiribatiKorea, Rep.KuwaitKyrgyz RepublicLao PDRLate-demographic dividendLatin America & Caribbean Latin America & Caribbean (excluding high income)Latin America & the Caribbean (IDA & IBRD countries)LatviaLeast developed countries: UN classificationLebanonLesothoLiberiaLibyaLithuaniaLow & middle incomeLow incomeLower middle incomeLuxembourgMacedonia, FYRMadagascarMalawiMalaysiaMaldivesMaliMauritaniaMauritiusMexicoMiddle East & North AfricaMiddle East & North Africa (excluding high income)Middle East & North Africa (IDA & IBRD countries)Middle incomeMoldovaMongoliaMoroccoMozambiqueMyanmarNamibiaNepalNetherlandsNew ZealandNicaraguaNigerNigeriaNorth AmericaNorwayOECD membersOmanOther small statesPacific island small statesPakistanPanamaPapua New GuineaParaguayPeruPhilippinesPolandPortugalPost-demographic dividendPre-demographic dividendQatarRomaniaRussian FederationRwandaSamoaSao Tome and PrincipeSaudi ArabiaSenegalSeychellesSierra LeoneSingaporeSlovak RepublicSloveniaSmall statesSolomon IslandsSouth AfricaSouth AsiaSouth Asia (IDA & IBRD)SpainSri LankaSt. LuciaSt. Vincent and the GrenadinesSub-Saharan Africa Sub-Saharan Africa (excluding high income)Sub-Saharan Africa (IDA & IBRD countries)SudanSurinameSwazilandSwedenSwitzerlandSyrian Arab RepublicTajikistanTanzaniaThailandTogoTongaTrinidad and TobagoTunisiaTurkeyTurkmenistanUgandaUkraineUnited Arab EmiratesUnited KingdomUnited StatesUpper middle incomeUruguayUzbekistanVanuatuVenezuela, RBVietnamWorldYemen, Rep.ZambiaZimbabwe Zeitlinie:
Diese Zeitleiste vorliegt die Graphik ab 1971 J. bis 2015 J. United Kingdom. Die Angaben bis 1970 J. sind nicht vorhanden. Die Zahl aktueller Beobachtungen nach Daten: 45.
Die Quelle (Bezeichnung):
Kennzahlen der Weltentwicklung
Die Quelle (Einrichtung):
World Bank staff estimates based on sources and methods in World Bank's "The Changing Wealth of Nations: Measuring Sustainable Development in the New Millennium" (2011).
Kategorien:
Economy & Growth
Es wurde aktualisiert:
23 Apr 2017 Jahr
Kennzahlen der Wertänderungen vom Jahr zum Jahr
im Durchschnitt:
1.061 Trln
Minimum:
116.347 Mlrd.
1 Jan 1971 Jahr
Maximum:
2.537 Trln
1 Jan 2008 Jahr
Zum Datum der Beobachtung
Wert
Absolute Veränderung
Die Veränderung bezüglich dem vorherigen Wert
1 Jan 1971 Jahr
116.347 Mlrd.
+116.347 Mlrd.
0.0%
1 Jan 1972 Jahr
130.521 Mlrd.
+14.173 Mlrd.
12.18%
1 Jan 1973 Jahr
148.804 Mlrd.
+18.283 Mlrd.
14.01%
1 Jan 1974 Jahr
167.839 Mlrd.
+19.035 Mlrd.
12.79%
1 Jan 1975 Jahr
178.409 Mlrd.
+10.569 Mlrd.
6.3%
1 Jan 1976 Jahr
210.08 Mlrd.
+31.672 Mlrd.
17.75%
1 Jan 1977 Jahr
200.699 Mlrd.
-9.381 Mlrd.
-4.47%
1 Jan 1978 Jahr
221.408 Mlrd.
+20.709 Mlrd.
10.32%
1 Jan 1979 Jahr
280.716 Mlrd.
+59.308 Mlrd.
26.79%
1 Jan 1980 Jahr
353.117 Mlrd.
+72.4 Mlrd.
25.79%
1 Jan 1981 Jahr
447.644 Mlrd.
+94.527 Mlrd.
26.77%
1 Jan 1982 Jahr
419.954 Mlrd.
-27.69 Mlrd.
-6.19%
1 Jan 1983 Jahr
398.556 Mlrd.
-21.399 Mlrd.
-5.1%
1 Jan 1984 Jahr
382.745 Mlrd.
-15.811 Mlrd.
-3.97%
1 Jan 1985 Jahr
359.75 Mlrd.
-22.995 Mlrd.
-6.01%
1 Jan 1986 Jahr
379.675 Mlrd.
+19.924 Mlrd.
5.54%
1 Jan 1987 Jahr
484.835 Mlrd.
+105.16 Mlrd.
27.7%
1 Jan 1988 Jahr
595.984 Mlrd.
+111.149 Mlrd.
22.93%
1 Jan 1989 Jahr
732.366 Mlrd.
+136.382 Mlrd.
22.88%
1 Jan 1990 Jahr
737.503 Mlrd.
+5.137 Mlrd.
0.7%
1 Jan 1991 Jahr
858.068 Mlrd.
+120.565 Mlrd.
16.35%
1 Jan 1992 Jahr
897.888 Mlrd.
+39.819 Mlrd.
4.64%
1 Jan 1993 Jahr
943.852 Mlrd.
+45.964 Mlrd.
5.12%
1 Jan 1994 Jahr
851.215 Mlrd.
-92.637 Mlrd.
-9.81%
1 Jan 1995 Jahr
936.123 Mlrd.
+84.908 Mlrd.
9.97%
1 Jan 1996 Jahr
1.022 Trln
+85.97 Mlrd.
9.18%
1 Jan 1997 Jahr
1.076 Trln
+53.435 Mlrd.
5.23%
1 Jan 1998 Jahr
1.216 Trln
+140.36 Mlrd.
13.05%
1 Jan 1999 Jahr
1.327 Trln
+111.45 Mlrd.
9.17%
1 Jan 2000 Jahr
1.333 Trln
+5.99 Mlrd.
0.45%
1 Jan 2001 Jahr
1.325 Trln
-8.637 Mlrd.
-0.65%
1 Jan 2002 Jahr
1.313 Trln
-11.273 Mlrd.
-0.85%
1 Jan 2003 Jahr
1.448 Trln
+134.186 Mlrd.
10.22%
1 Jan 2004 Jahr
1.671 Trln
+223.455 Mlrd.
15.44%
1 Jan 2005 Jahr
1.982 Trln
+310.476 Mlrd.
18.58%
1 Jan 2006 Jahr
2.097 Trln
+115.119 Mlrd.
5.81%
1 Jan 2007 Jahr
2.207 Trln
+110.096 Mlrd.
5.25%
1 Jan 2008 Jahr
2.537 Trln
+330.494 Mlrd.
14.98%
1 Jan 2009 Jahr
2.369 Trln
-168.457 Mlrd.
-6.64%
1 Jan 2010 Jahr
1.974 Trln
-394.44 Mlrd.
-16.65%
1 Jan 2011 Jahr
2.082 Trln
+107.89 Mlrd.
5.46%
1 Jan 2012 Jahr
2.252 Trln
+169.294 Mlrd.
8.13%
1 Jan 2013 Jahr
2.256 Trln
+4.611 Mlrd.
0.2%
1 Jan 2014 Jahr
2.303 Trln
+46.67 Mlrd.
2.07%
1 Jan 2015 Jahr
2.52 Trln
+217.625 Mlrd.
9.45%
Bewertung der Länder gemäß mit laufender Statistik nach Jahren


Kommentare: