29
/de/
de
AIzaSyAYiBZKx7MnpbEhh9jyipgxe19OcubqV5w
April 1, 2024
275119
United Arab Emirates
ARE
true
2
1
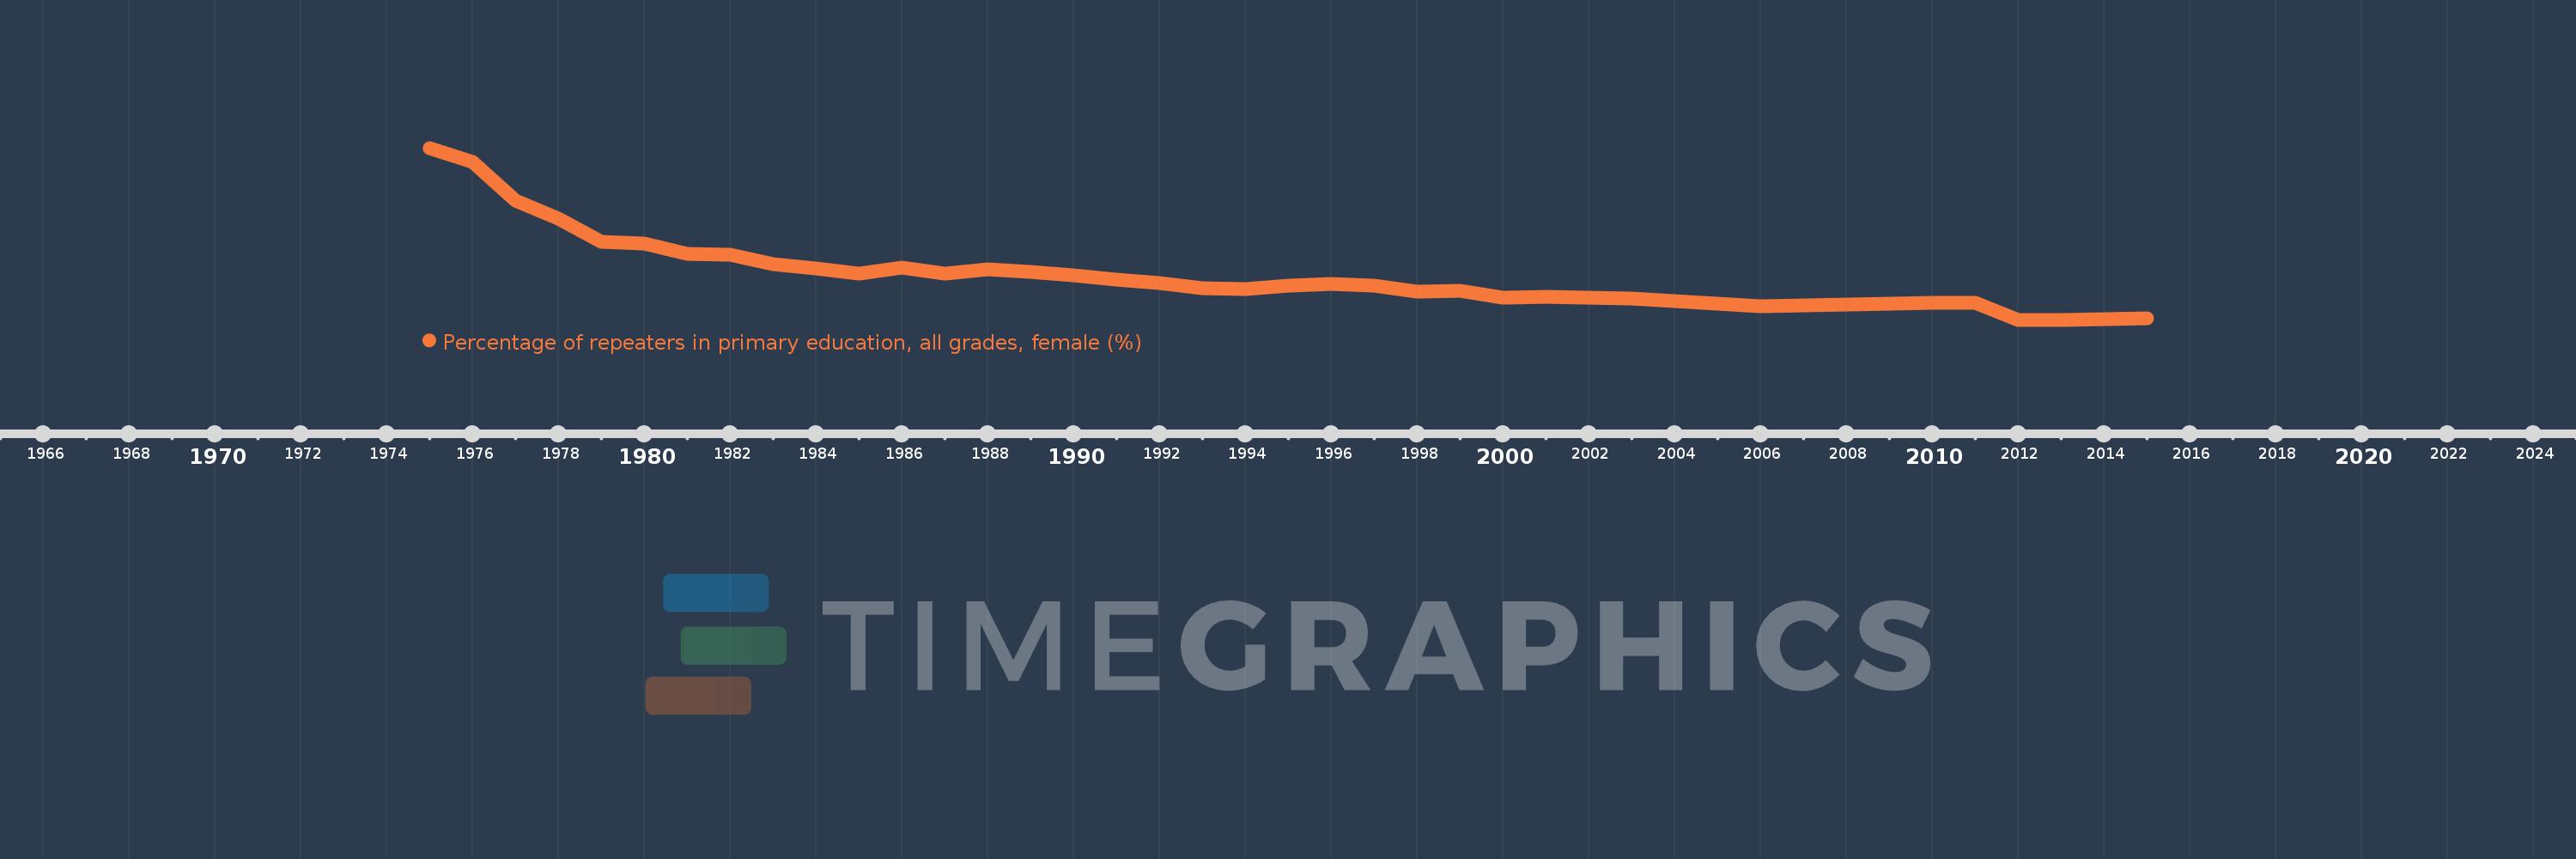
Percentage of repeaters in primary education, all grades, female (%)
2015,2013,2012,2011,2010,2008,2007,2006,2005,2004,2003,2002,2001,2000,1999,1998,1997,1996,1995,1994,1993,1992,1991,1990,1989,1988,1987,1986,1985,1984,1983,1982,1981,1980,1979,1978,1977,1976,1975
Diese Statistik in anderen Ländern:
AfghanistanAlbaniaAlgeriaAndorraAngolaAntigua and BarbudaArab WorldArgentinaArmeniaArubaAustriaAzerbaijanBahamas, TheBahrainBangladeshBelarusBelgiumBelizeBeninBermudaBhutanBoliviaBosnia and HerzegovinaBotswanaBrazilBritish Virgin IslandsBrunei DarussalamBulgariaBurkina FasoBurundiCabo VerdeCambodiaCameroonCanadaCaribbean small statesCayman IslandsCentral African RepublicCentral Europe and the BalticsChadChileChinaColombiaComorosCongo, Dem. Rep.Congo, Rep.Costa RicaCote d'IvoireCroatiaCubaCyprusCzech RepublicDenmarkDjiboutiDominicaDominican RepublicEarly-demographic dividendEast Asia & PacificEast Asia & Pacific (excluding high income)East Asia & Pacific (IDA & IBRD countries)EcuadorEgypt, Arab Rep.El SalvadorEquatorial GuineaEritreaEstoniaEthiopiaEuro areaEurope & Central AsiaEurope & Central Asia (excluding high income)Europe & Central Asia (IDA & IBRD countries)European UnionFijiFinlandFragile and conflict affected situationsFranceGabonGambia, TheGeorgiaGermanyGhanaGreeceGrenadaGuatemalaGuineaGuinea-BissauGuyanaHaitiHeavily indebted poor countries (HIPC)High incomeHondurasHong Kong SAR, ChinaHungaryIBRD onlyIcelandIDA & IBRD totalIDA blendIDA onlyIDA totalIndiaIndonesiaIran, Islamic Rep.IraqIrelandIsraelItalyJamaicaJapanJordanKazakhstanKenyaKiribatiKorea, Rep.KuwaitKyrgyz RepublicLao PDRLate-demographic dividendLatin America & Caribbean Latin America & Caribbean (excluding high income)Latin America & the Caribbean (IDA & IBRD countries)LatviaLeast developed countries: UN classificationLebanonLesothoLiberiaLibyaLiechtensteinLithuaniaLow & middle incomeLow incomeLower middle incomeLuxembourgMacao SAR, ChinaMacedonia, FYRMadagascarMalawiMalaysiaMaldivesMaliMaltaMauritaniaMauritiusMexicoMiddle East & North AfricaMiddle East & North Africa (excluding high income)Middle East & North Africa (IDA & IBRD countries)Middle incomeMoldovaMonacoMongoliaMontenegroMoroccoMozambiqueMyanmarNamibiaNauruNepalNetherlandsNew ZealandNicaraguaNigerNorwayOECD membersOmanOther small statesPacific island small statesPakistanPalauPanamaPapua New GuineaParaguayPeruPhilippinesPolandPortugalPost-demographic dividendPre-demographic dividendQatarRomaniaRussian FederationRwandaSamoaSan MarinoSao Tome and PrincipeSaudi ArabiaSenegalSerbiaSeychellesSierra LeoneSingaporeSint Maarten (Dutch part)Slovak RepublicSloveniaSmall statesSolomon IslandsSomaliaSouth AfricaSouth AsiaSouth Asia (IDA & IBRD)South SudanSpainSri LankaSt. Kitts and NevisSt. LuciaSt. Vincent and the GrenadinesSub-Saharan Africa Sub-Saharan Africa (excluding high income)Sub-Saharan Africa (IDA & IBRD countries)SudanSurinameSwazilandSwedenSwitzerlandSyrian Arab RepublicTajikistanTanzaniaThailandTimor-LesteTogoTongaTrinidad and TobagoTunisiaTurkeyTurks and Caicos IslandsTuvaluUgandaUkraineUnited Arab EmiratesUnited KingdomUpper middle incomeUruguayUzbekistanVanuatuVenezuela, RBVietnamWest Bank and GazaWorldYemen, Rep.ZambiaZimbabwe Zeitlinie:
Diese Zeitleiste vorliegt die Graphik ab 1975 J. bis 2015 J. United Arab Emirates. Die Angaben bis 1974 J. sind nicht vorhanden. Die Zahl aktueller Beobachtungen nach Daten: 39.
Die Quelle (Bezeichnung):
Kennzahlen der Weltentwicklung
Die Quelle (Einrichtung):
UNESCO Institute for Statistics
Kategorien:
Education, Gender
Es wurde aktualisiert:
23 Apr 2017 Jahr
Kennzahlen der Wertänderungen vom Jahr zum Jahr
Minimum:
0.0
1 Jan 2012 Jahr
Maximum:
19.314
1 Jan 1975 Jahr
Zum Datum der Beobachtung
Wert
Absolute Veränderung
Die Veränderung bezüglich dem vorherigen Wert
1 Jan 1975 Jahr
19.314
+19.314
0.0%
1 Jan 1976 Jahr
17.733
-1.581
-8.19%
1 Jan 1977 Jahr
13.408
-4.325
-24.39%
1 Jan 1978 Jahr
11.38
-2.029
-15.13%
1 Jan 1979 Jahr
8.75
-2.629
-23.11%
1 Jan 1980 Jahr
8.535
-0.215
-2.45%
1 Jan 1981 Jahr
7.367
-1.168
-13.69%
1 Jan 1982 Jahr
7.276
-0.091
-1.23%
1 Jan 1983 Jahr
6.201
-1.075
-14.77%
1 Jan 1984 Jahr
5.728
-0.473
-7.63%
1 Jan 1985 Jahr
5.198
-0.53
-9.26%
1 Jan 1986 Jahr
5.814
+0.616
11.85%
1 Jan 1987 Jahr
5.215
-0.599
-10.3%
1 Jan 1988 Jahr
5.707
+0.492
9.43%
1 Jan 1989 Jahr
5.397
-0.31
-5.43%
1 Jan 1990 Jahr
5.036
-0.361
-6.69%
1 Jan 1991 Jahr
4.512
-0.524
-10.4%
1 Jan 1992 Jahr
4.101
-0.411
-9.12%
1 Jan 1993 Jahr
3.562
-0.539
-13.14%
1 Jan 1994 Jahr
3.454
-0.108
-3.02%
1 Jan 1995 Jahr
3.814
+0.36
10.42%
1 Jan 1996 Jahr
4.018
+0.204
5.35%
1 Jan 1997 Jahr
3.878
-0.14
-3.48%
1 Jan 1998 Jahr
3.141
-0.737
-19.01%
1 Jan 1999 Jahr
3.282
+0.14
4.46%
1 Jan 2000 Jahr
2.469
-0.812
-24.75%
1 Jan 2001 Jahr
2.61
+0.14
5.68%
1 Jan 2002 Jahr
2.512
-0.097
-3.72%
1 Jan 2003 Jahr
2.423
-0.089
-3.56%
1 Jan 2004 Jahr
2.059
-0.364
-15.02%
1 Jan 2005 Jahr
1.809
-0.25
-12.16%
1 Jan 2006 Jahr
1.526
-0.282
-15.62%
1 Jan 2007 Jahr
1.65
+0.124
8.14%
1 Jan 2008 Jahr
1.705
+0.055
3.33%
1 Jan 2010 Jahr
1.931
+0.225
13.22%
1 Jan 2011 Jahr
1.899
-0.032
-1.63%
1 Jan 2012 Jahr
0.0
-1.899
-100.0%
1 Jan 2015 Jahr
0.161
+0.161
%
Bewertung der Länder gemäß mit laufender Statistik nach Jahren


Kommentare: