29
/de/
de
AIzaSyAYiBZKx7MnpbEhh9jyipgxe19OcubqV5w
April 1, 2024
273932
Ukraine
UKR
true
2
1
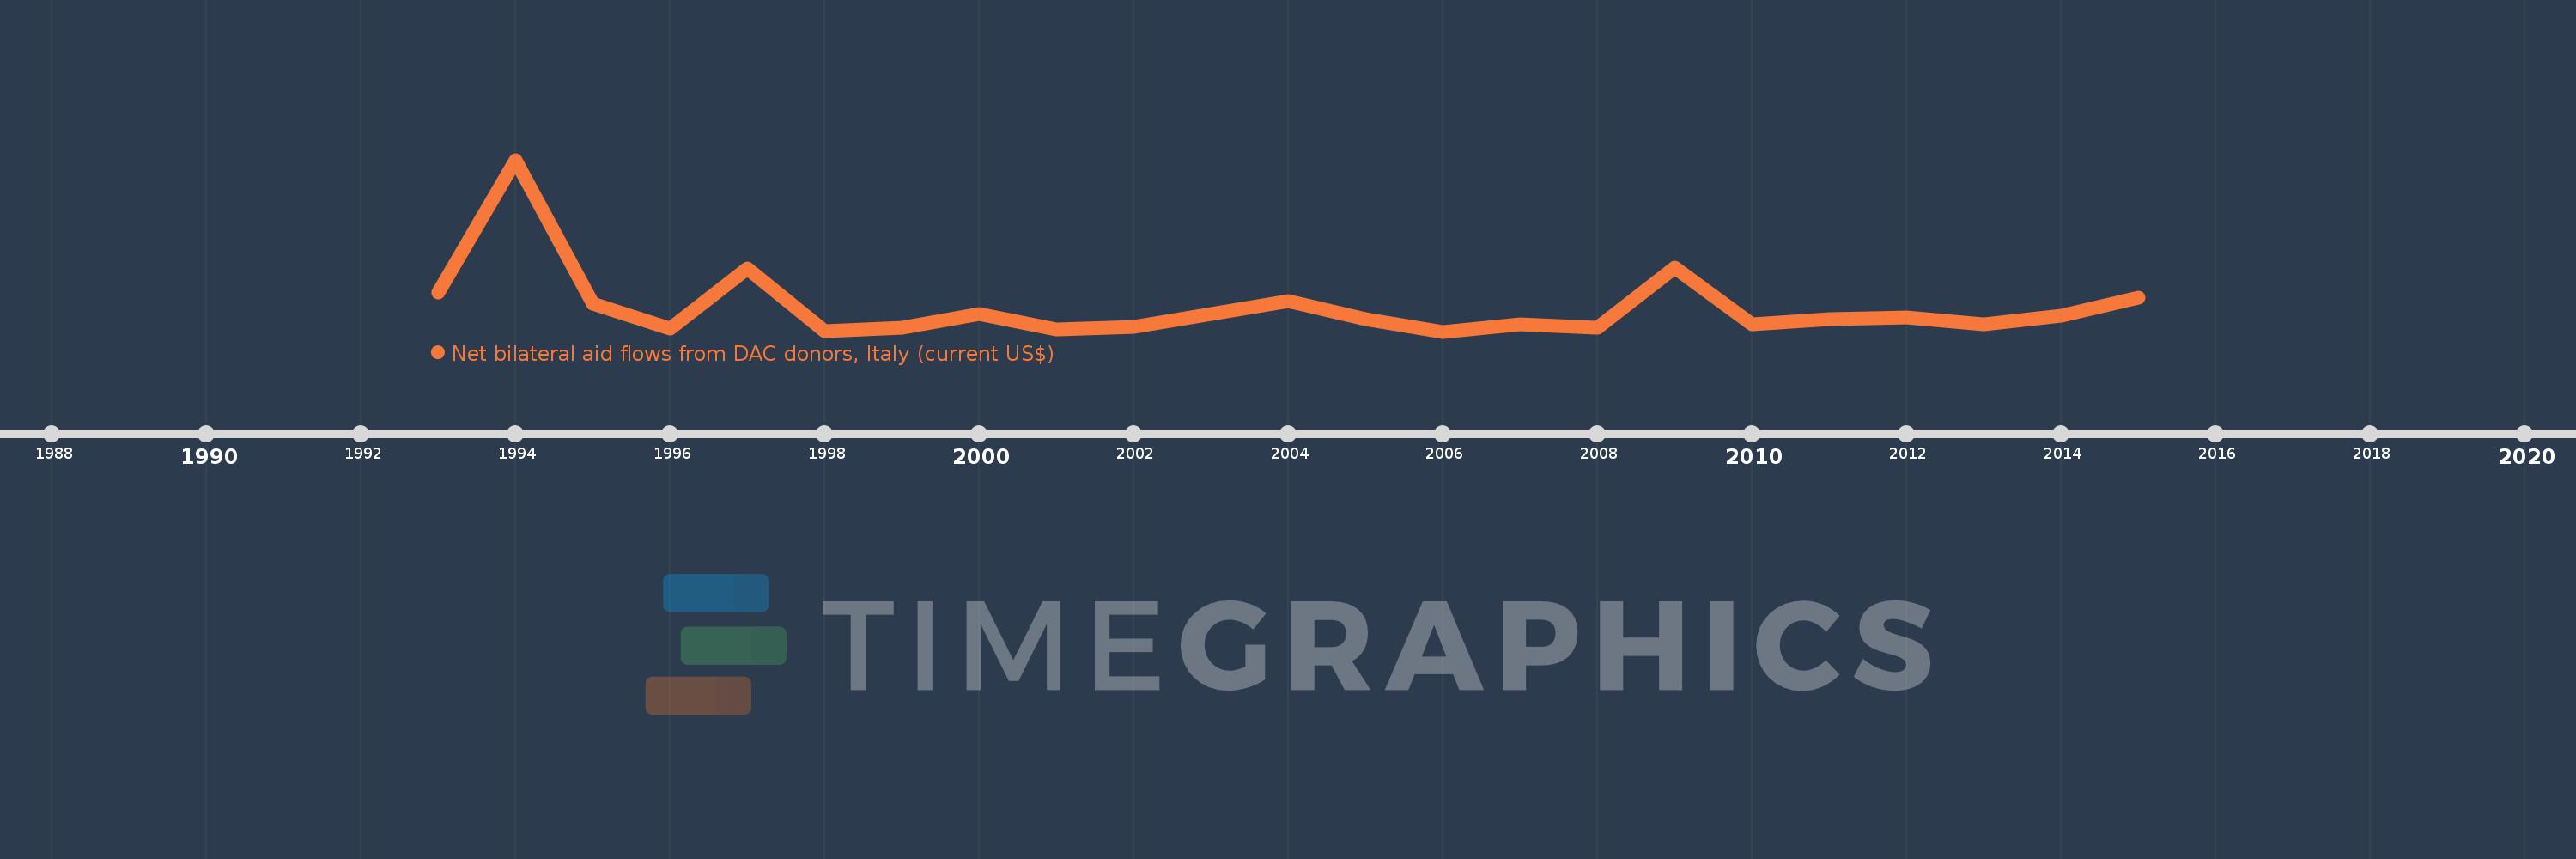
Net bilateral aid flows from DAC donors, Italy (current US$)
2015,2014,2013,2012,2011,2010,2009,2008,2007,2006,2005,2004,2002,2001,2000,1999,1998,1997,1996,1995,1994,1993
Diese Statistik in anderen Ländern:
AfghanistanAlbaniaAlgeriaAngolaAntigua and BarbudaArab WorldArgentinaArmeniaAzerbaijanBahamas, TheBangladeshBarbadosBelarusBelizeBeninBhutanBoliviaBosnia and HerzegovinaBotswanaBrazilBulgariaBurkina FasoBurundiCabo VerdeCambodiaCameroonCaribbean small statesCentral African RepublicCentral Europe and the BalticsChadChileChinaColombiaComorosCongo, Dem. Rep.Congo, Rep.Costa RicaCote d'IvoireCroatiaCubaCyprusCzech RepublicDjiboutiDominicaDominican RepublicEast Asia & PacificEast Asia & Pacific (excluding high income)East Asia & Pacific (IDA & IBRD countries)EcuadorEgypt, Arab Rep.El SalvadorEquatorial GuineaEritreaEstoniaEthiopiaEuro areaEurope & Central AsiaEurope & Central Asia (excluding high income)Europe & Central Asia (IDA & IBRD countries)European UnionFijiFragile and conflict affected situationsGabonGambia, TheGeorgiaGhanaGuatemalaGuineaGuinea-BissauGuyanaHaitiHeavily indebted poor countries (HIPC)High incomeHondurasHong Kong SAR, ChinaHungaryIBRD onlyIDA & IBRD totalIDA blendIDA onlyIDA totalIndiaIndonesiaIran, Islamic Rep.IraqIsraelJamaicaJordanKazakhstanKenyaKiribatiKorea, Dem. People’s Rep.Korea, Rep.KosovoKuwaitKyrgyz RepublicLao PDRLatin America & Caribbean Latin America & Caribbean (excluding high income)Latin America & the Caribbean (IDA & IBRD countries)LatviaLeast developed countries: UN classificationLebanonLesothoLiberiaLibyaLithuaniaLow & middle incomeLow incomeLower middle incomeMacedonia, FYRMadagascarMalawiMalaysiaMaldivesMaliMaltaMarshall IslandsMauritaniaMauritiusMexicoMiddle East & North AfricaMiddle East & North Africa (excluding high income)Middle East & North Africa (IDA & IBRD countries)Middle incomeMoldovaMongoliaMontenegroMoroccoMozambiqueMyanmarNamibiaNauruNepalNicaraguaNigerNigeriaOECD membersOmanOther small statesPacific island small statesPakistanPalauPanamaPapua New GuineaParaguayPeruPhilippinesPolandRomaniaRussian FederationRwandaSamoaSao Tome and PrincipeSaudi ArabiaSenegalSerbiaSeychellesSierra LeoneSingaporeSlovak RepublicSloveniaSmall statesSolomon IslandsSomaliaSouth AfricaSouth AsiaSouth Asia (IDA & IBRD)South SudanSri LankaSt. Kitts and NevisSt. LuciaSt. Vincent and the GrenadinesSub-Saharan Africa Sub-Saharan Africa (excluding high income)Sub-Saharan Africa (IDA & IBRD countries)SudanSurinameSwazilandSyrian Arab RepublicTajikistanTanzaniaThailandTimor-LesteTogoTongaTrinidad and TobagoTunisiaTurkeyTurkmenistanTuvaluUgandaUkraineUnited Arab EmiratesUpper middle incomeUruguayUzbekistanVanuatuVenezuela, RBVietnamWest Bank and GazaWorldYemen, Rep.ZambiaZimbabwe Zeitlinie:
Diese Zeitleiste vorliegt die Graphik ab 1993 J. bis 2015 J. Ukraine. Die Angaben bis 1992 J. sind nicht vorhanden. Die Zahl aktueller Beobachtungen nach Daten: 22.
Die Quelle (Bezeichnung):
Kennzahlen der Weltentwicklung
Die Quelle (Einrichtung):
Development Assistance Committee of the Organisation for Economic Co-operation and Development, Geographical Distribution of Financial Flows to Developing Countries, Development Co-operation Report, and International Development Statistics database. Data are available online at: www.oecd.org/dac/stats/idsonline.
Kategorien:
Aid Effectiveness
Es wurde aktualisiert:
23 Apr 2017 Jahr
Kennzahlen der Wertänderungen vom Jahr zum Jahr
im Durchschnitt:
542.727 Tsnd.
Minimum:
20.0 Tsnd.
1 Jan 2006 Jahr
Maximum:
3.66 Mln.
1 Jan 1994 Jahr
Zum Datum der Beobachtung
Wert
Absolute Veränderung
Die Veränderung bezüglich dem vorherigen Wert
1 Jan 1993 Jahr
840.0 Tsnd.
+840.0 Tsnd.
0.0%
1 Jan 1994 Jahr
3.66 Mln.
+2.82 Mln.
335.71%
1 Jan 1995 Jahr
620.0 Tsnd.
-3.04 Mln.
-83.06%
1 Jan 1996 Jahr
80.0 Tsnd.
-540.0 Tsnd.
-87.1%
1 Jan 1997 Jahr
1.36 Mln.
+1.28 Mln.
1.6 Tsnd.%
1 Jan 1998 Jahr
30.0 Tsnd.
-1.33 Mln.
-97.79%
1 Jan 1999 Jahr
100.0 Tsnd.
+70.0 Tsnd.
233.33%
1 Jan 2000 Jahr
400.0 Tsnd.
+300.0 Tsnd.
300.0%
1 Jan 2001 Jahr
60.0 Tsnd.
-340.0 Tsnd.
-85.0%
1 Jan 2002 Jahr
120.0 Tsnd.
+60.0 Tsnd.
100.0%
1 Jan 2004 Jahr
660.0 Tsnd.
+540.0 Tsnd.
450.0%
1 Jan 2005 Jahr
280.0 Tsnd.
-380.0 Tsnd.
-57.58%
1 Jan 2006 Jahr
20.0 Tsnd.
-260.0 Tsnd.
-92.86%
1 Jan 2007 Jahr
180.0 Tsnd.
+160.0 Tsnd.
800.0%
1 Jan 2008 Jahr
100.0 Tsnd.
-80.0 Tsnd.
-44.44%
1 Jan 2009 Jahr
1.38 Mln.
+1.28 Mln.
1.28 Tsnd.%
1 Jan 2010 Jahr
180.0 Tsnd.
-1.2 Mln.
-86.96%
1 Jan 2011 Jahr
280.0 Tsnd.
+100.0 Tsnd.
55.56%
1 Jan 2012 Jahr
320.0 Tsnd.
+40.0 Tsnd.
14.29%
1 Jan 2013 Jahr
180.0 Tsnd.
-140.0 Tsnd.
-43.75%
1 Jan 2014 Jahr
360.0 Tsnd.
+180.0 Tsnd.
100.0%
1 Jan 2015 Jahr
730.0 Tsnd.
+370.0 Tsnd.
102.78%
Bewertung der Länder gemäß mit laufender Statistik nach Jahren


Kommentare: