29
/de/
de
AIzaSyAYiBZKx7MnpbEhh9jyipgxe19OcubqV5w
April 1, 2024
27299
East Asia & Pacific
EAS
false
2
1
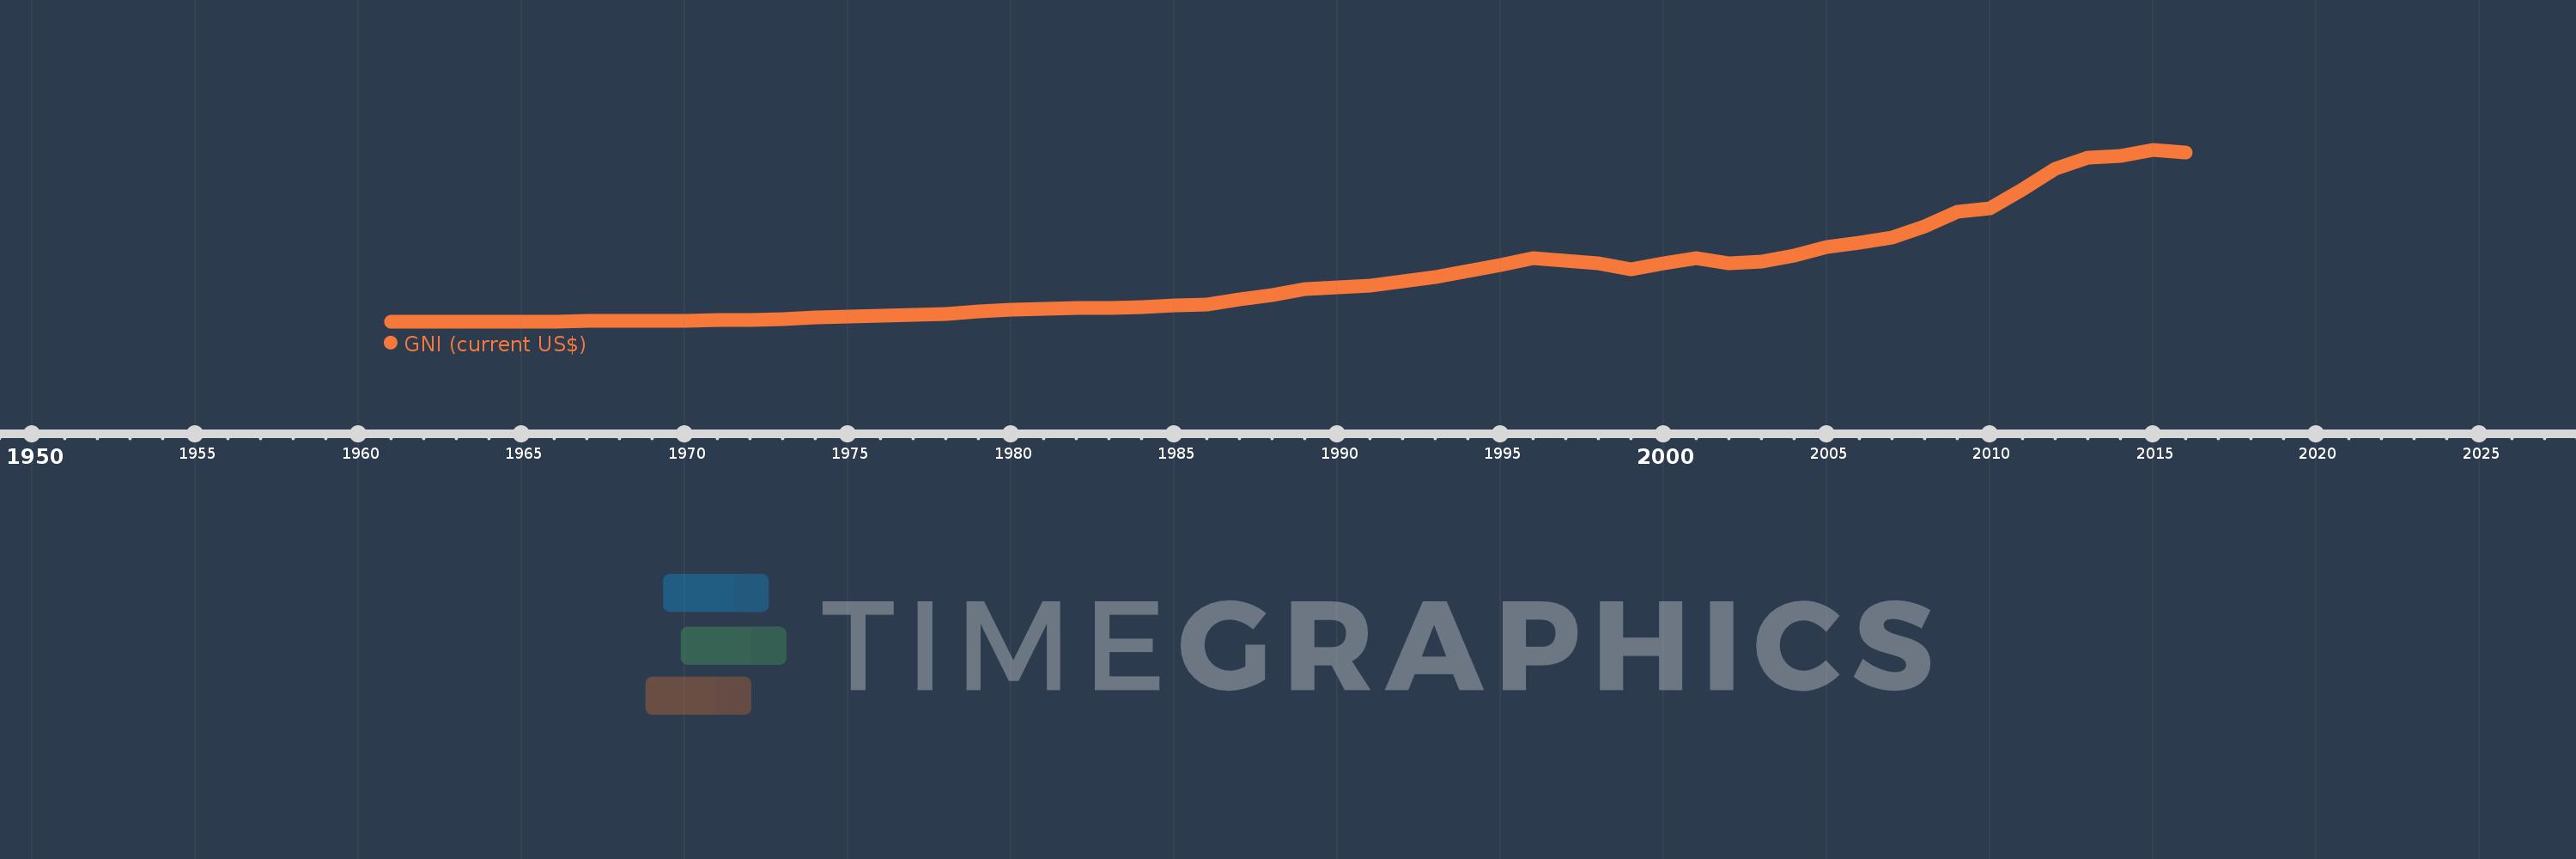
GNI (current US$)
2016,2015,2014,2013,2012,2011,2010,2009,2008,2007,2006,2005,2004,2003,2002,2001,2000,1999,1998,1997,1996,1995,1994,1993,1992,1991,1990,1989,1988,1987,1986,1985,1984,1983,1982,1981,1980,1979,1978,1977,1976,1975,1974,1973,1972,1971,1970,1969,1968,1967,1966,1965,1964,1963,1962,1961
Diese Statistik in anderen Ländern:
AfghanistanAlbaniaAlgeriaAmerican SamoaAndorraAngolaAntigua and BarbudaArab WorldArgentinaArmeniaAustraliaAustriaAzerbaijanBahamas, TheBahrainBangladeshBarbadosBelarusBelgiumBelizeBeninBermudaBhutanBoliviaBosnia and HerzegovinaBotswanaBrazilBrunei DarussalamBulgariaBurkina FasoBurundiCabo VerdeCambodiaCameroonCanadaCaribbean small statesCentral African RepublicCentral Europe and the BalticsChadChannel IslandsChileChinaColombiaComorosCongo, Dem. Rep.Congo, Rep.Costa RicaCote d'IvoireCroatiaCubaCyprusCzech RepublicDenmarkDjiboutiDominicaDominican RepublicEarly-demographic dividendEast Asia & PacificEast Asia & Pacific (excluding high income)East Asia & Pacific (IDA & IBRD countries)EcuadorEgypt, Arab Rep.El SalvadorEquatorial GuineaEritreaEstoniaEthiopiaEuro areaEurope & Central AsiaEurope & Central Asia (excluding high income)Europe & Central Asia (IDA & IBRD countries)European UnionFaroe IslandsFijiFinlandFragile and conflict affected situationsFranceFrench PolynesiaGabonGambia, TheGeorgiaGermanyGhanaGreeceGreenlandGrenadaGuatemalaGuineaGuinea-BissauGuyanaHaitiHeavily indebted poor countries (HIPC)High incomeHondurasHong Kong SAR, ChinaHungaryIBRD onlyIcelandIDA & IBRD totalIDA blendIDA onlyIDA totalIndiaIndonesiaIran, Islamic Rep.IraqIrelandIsle of ManIsraelItalyJamaicaJapanJordanKazakhstanKenyaKiribatiKorea, Rep.KosovoKuwaitKyrgyz RepublicLao PDRLate-demographic dividendLatin America & Caribbean Latin America & Caribbean (excluding high income)Latin America & the Caribbean (IDA & IBRD countries)LatviaLeast developed countries: UN classificationLebanonLesothoLiberiaLibyaLiechtensteinLithuaniaLow & middle incomeLow incomeLower middle incomeLuxembourgMacao SAR, ChinaMacedonia, FYRMadagascarMalawiMalaysiaMaldivesMaliMaltaMarshall IslandsMauritaniaMauritiusMexicoMicronesia, Fed. Sts.Middle East & North AfricaMiddle East & North Africa (excluding high income)Middle East & North Africa (IDA & IBRD countries)Middle incomeMoldovaMonacoMongoliaMontenegroMoroccoMozambiqueMyanmarNamibiaNauruNepalNetherlandsNew CaledoniaNew ZealandNicaraguaNigerNigeriaNorth AmericaNorwayOECD membersOmanOther small statesPacific island small statesPakistanPalauPanamaPapua New GuineaParaguayPeruPhilippinesPolandPortugalPost-demographic dividendPre-demographic dividendPuerto RicoQatarRomaniaRussian FederationRwandaSamoaSan MarinoSao Tome and PrincipeSaudi ArabiaSenegalSerbiaSeychellesSierra LeoneSingaporeSlovak RepublicSloveniaSmall statesSolomon IslandsSomaliaSouth AfricaSouth AsiaSouth Asia (IDA & IBRD)South SudanSpainSri LankaSt. Kitts and NevisSt. LuciaSt. Vincent and the GrenadinesSub-Saharan Africa Sub-Saharan Africa (excluding high income)Sub-Saharan Africa (IDA & IBRD countries)SudanSurinameSwazilandSwedenSwitzerlandSyrian Arab RepublicTajikistanTanzaniaThailandTimor-LesteTogoTongaTrinidad and TobagoTunisiaTurkeyTurkmenistanTuvaluUgandaUkraineUnited Arab EmiratesUnited KingdomUnited StatesUpper middle incomeUruguayUzbekistanVanuatuVenezuela, RBVietnamVirgin Islands (U.S.)West Bank and GazaWorldYemen, Rep.ZambiaZimbabwe Zeitlinie:
Diese Zeitleiste vorliegt die Graphik ab 1961 J. bis 2016 J. East Asia & Pacific. Die Angaben bis 1960 J. sind nicht vorhanden. Die Zahl aktueller Beobachtungen nach Daten: 56.
Die Quelle (Bezeichnung):
Kennzahlen der Weltentwicklung
Die Quelle (Einrichtung):
World Bank national accounts data, and OECD National Accounts data files.
Kategorien:
Economy & Growth, External Debt
Es wurde aktualisiert:
23 Apr 2017 Jahr
Kennzahlen der Wertänderungen vom Jahr zum Jahr
im Durchschnitt:
5.914 Trln
Minimum:
149.11 Mlrd.
1 Jan 1961 Jahr
Maximum:
21.771 Trln
1 Jan 2015 Jahr
Zum Datum der Beobachtung
Wert
Absolute Veränderung
Die Veränderung bezüglich dem vorherigen Wert
1 Jan 1961 Jahr
149.11 Mlrd.
+149.11 Mlrd.
0.0%
1 Jan 1962 Jahr
149.298 Mlrd.
+188.532 Mln.
0.13%
1 Jan 1963 Jahr
152.311 Mlrd.
+3.013 Mlrd.
2.02%
1 Jan 1964 Jahr
169.872 Mlrd.
+17.561 Mlrd.
11.53%
1 Jan 1965 Jahr
195.553 Mlrd.
+25.681 Mlrd.
15.12%
1 Jan 1966 Jahr
220.472 Mlrd.
+24.919 Mlrd.
12.74%
1 Jan 1967 Jahr
247.023 Mlrd.
+26.551 Mlrd.
12.04%
1 Jan 1968 Jahr
268.106 Mlrd.
+21.083 Mlrd.
8.53%
1 Jan 1969 Jahr
296.515 Mlrd.
+28.408 Mlrd.
10.6%
1 Jan 1970 Jahr
341.819 Mlrd.
+45.305 Mlrd.
15.28%
1 Jan 1971 Jahr
400.996 Mlrd.
+59.177 Mlrd.
17.31%
1 Jan 1972 Jahr
445.73 Mlrd.
+44.734 Mlrd.
11.16%
1 Jan 1973 Jahr
553.181 Mlrd.
+107.451 Mlrd.
24.11%
1 Jan 1974 Jahr
728.801 Mlrd.
+175.62 Mlrd.
31.75%
1 Jan 1975 Jahr
837.646 Mlrd.
+108.845 Mlrd.
14.93%
1 Jan 1976 Jahr
917.854 Mlrd.
+80.208 Mlrd.
9.58%
1 Jan 1977 Jahr
1.009 Trln
+90.653 Mlrd.
9.88%
1 Jan 1978 Jahr
1.202 Trln
+193.841 Mlrd.
19.22%
1 Jan 1979 Jahr
1.517 Trln
+314.474 Mlrd.
26.15%
1 Jan 1980 Jahr
1.646 Trln
+129.517 Mlrd.
8.54%
1 Jan 1981 Jahr
1.778 Trln
+131.907 Mlrd.
8.01%
1 Jan 1982 Jahr
1.963 Trln
+185.046 Mlrd.
10.41%
1 Jan 1983 Jahr
1.921 Trln
-42.244 Mlrd.
-2.15%
1 Jan 1984 Jahr
2.043 Trln
+121.556 Mlrd.
6.33%
1 Jan 1985 Jahr
2.188 Trln
+145.228 Mlrd.
7.11%
1 Jan 1986 Jahr
2.322 Trln
+134.664 Mlrd.
6.16%
1 Jan 1987 Jahr
3.024 Trln
+701.137 Mlrd.
30.19%
1 Jan 1988 Jahr
3.537 Trln
+513.324 Mlrd.
16.98%
1 Jan 1989 Jahr
4.285 Trln
+748.132 Mlrd.
21.15%
1 Jan 1990 Jahr
4.504 Trln
+219.393 Mlrd.
5.12%
1 Jan 1991 Jahr
4.714 Trln
+209.448 Mlrd.
4.65%
1 Jan 1992 Jahr
5.299 Trln
+585.491 Mlrd.
12.42%
1 Jan 1993 Jahr
5.794 Trln
+494.64 Mlrd.
9.33%
1 Jan 1994 Jahr
6.51 Trln
+716.17 Mlrd.
12.36%
1 Jan 1995 Jahr
7.263 Trln
+753.125 Mlrd.
11.57%
1 Jan 1996 Jahr
8.189 Trln
+925.523 Mlrd.
12.74%
1 Jan 1997 Jahr
7.875 Trln
-313.818 Mlrd.
-3.83%
1 Jan 1998 Jahr
7.575 Trln
-300.101 Mlrd.
-3.81%
1 Jan 1999 Jahr
6.755 Trln
-819.532 Mlrd.
-10.82%
1 Jan 2000 Jahr
7.542 Trln
+786.99 Mlrd.
11.65%
1 Jan 2001 Jahr
8.143 Trln
+600.895 Mlrd.
7.97%
1 Jan 2002 Jahr
7.586 Trln
-557.79 Mlrd.
-6.85%
1 Jan 2003 Jahr
7.707 Trln
+121.974 Mlrd.
1.61%
1 Jan 2004 Jahr
8.507 Trln
+799.533 Mlrd.
10.37%
1 Jan 2005 Jahr
9.545 Trln
+1.038 Trln
12.2%
1 Jan 2006 Jahr
10.153 Trln
+608.151 Mlrd.
6.37%
1 Jan 2007 Jahr
10.824 Trln
+670.436 Mlrd.
6.6%
1 Jan 2008 Jahr
12.165 Trln
+1.341 Trln
12.39%
1 Jan 2009 Jahr
14.067 Trln
+1.902 Trln
15.64%
1 Jan 2010 Jahr
14.445 Trln
+378.798 Mlrd.
2.69%
1 Jan 2011 Jahr
16.834 Trln
+2.388 Trln
16.53%
1 Jan 2012 Jahr
19.446 Trln
+2.612 Trln
15.52%
1 Jan 2013 Jahr
20.884 Trln
+1.438 Trln
7.4%
1 Jan 2014 Jahr
21.055 Trln
+170.954 Mlrd.
0.82%
1 Jan 2015 Jahr
21.771 Trln
+716.076 Mlrd.
3.4%
1 Jan 2016 Jahr
21.515 Trln
-255.928 Mlrd.
-1.18%
Bewertung der Länder gemäß mit laufender Statistik nach Jahren


Kommentare: