29
/de/
de
AIzaSyAYiBZKx7MnpbEhh9jyipgxe19OcubqV5w
April 1, 2024
268395
Tunisia
TUN
true
2
1
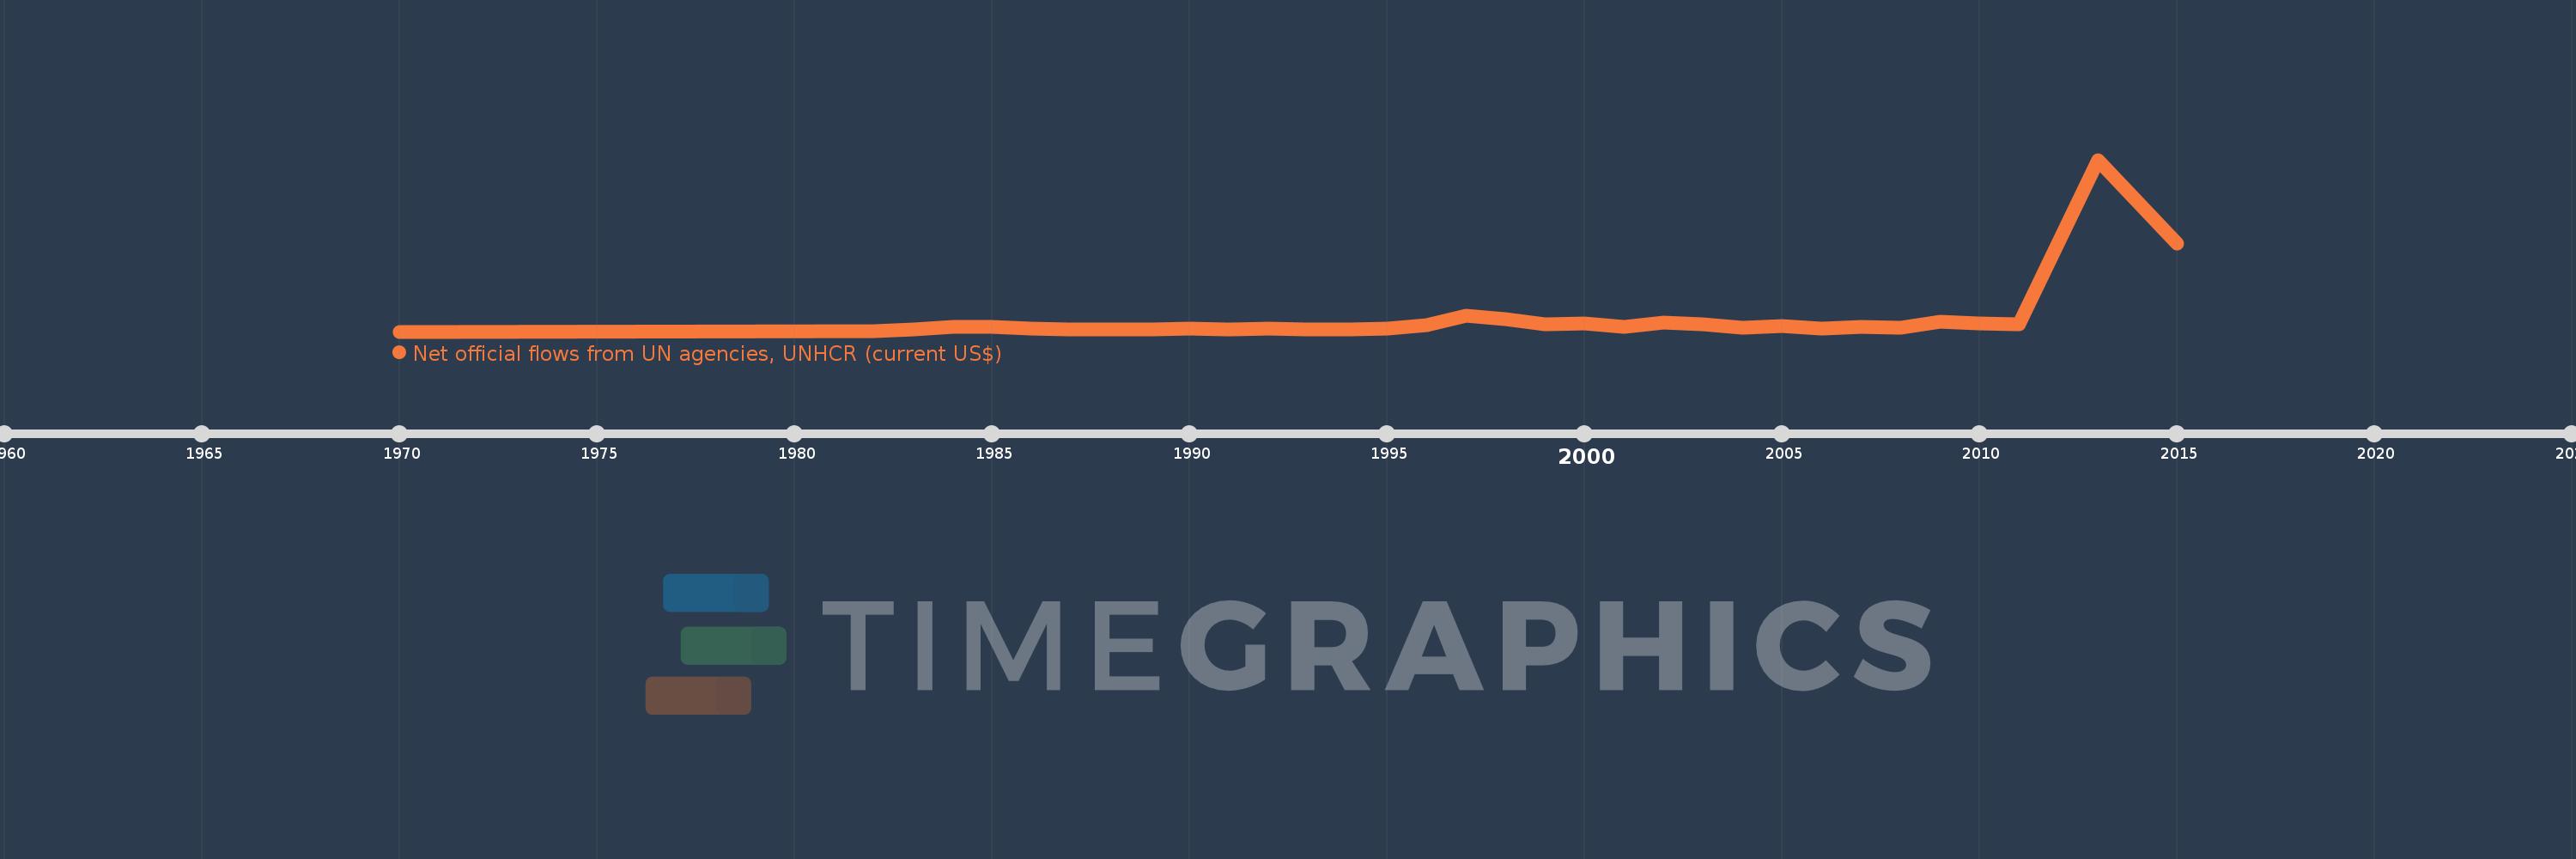
Net official flows from UN agencies, UNHCR (current US$)
2015,2013,2011,2010,2009,2008,2007,2006,2005,2004,2003,2002,2001,2000,1999,1998,1997,1996,1995,1994,1993,1992,1991,1990,1989,1987,1986,1985,1984,1983,1982,1970
Diese Statistik in anderen Ländern:
AfghanistanAlbaniaAlgeriaAngolaArab WorldArgentinaArmeniaAzerbaijanBahrainBangladeshBelarusBelizeBeninBoliviaBosnia and HerzegovinaBotswanaBrazilBulgariaBurkina FasoBurundiCabo VerdeCambodiaCameroonCaribbean small statesCentral African RepublicCentral Europe and the BalticsChadChileChinaColombiaComorosCongo, Dem. Rep.Congo, Rep.Costa RicaCote d'IvoireCroatiaCubaCyprusCzech RepublicDjiboutiDominican RepublicEast Asia & PacificEast Asia & Pacific (excluding high income)East Asia & Pacific (IDA & IBRD countries)EcuadorEgypt, Arab Rep.El SalvadorEquatorial GuineaEritreaEthiopiaEuro areaEurope & Central AsiaEurope & Central Asia (excluding high income)Europe & Central Asia (IDA & IBRD countries)European UnionFragile and conflict affected situationsGabonGambia, TheGeorgiaGhanaGuatemalaGuineaGuinea-BissauHaitiHeavily indebted poor countries (HIPC)High incomeHondurasHong Kong SAR, ChinaHungaryIBRD onlyIDA & IBRD totalIDA blendIDA onlyIDA totalIndiaIndonesiaIran, Islamic Rep.IraqIsraelJamaicaJordanKazakhstanKenyaKorea, Dem. People’s Rep.Korea, Rep.KosovoKuwaitKyrgyz RepublicLao PDRLatin America & Caribbean Latin America & Caribbean (excluding high income)Latin America & the Caribbean (IDA & IBRD countries)LatviaLeast developed countries: UN classificationLebanonLesothoLiberiaLibyaLow & middle incomeLow incomeLower middle incomeMacao SAR, ChinaMacedonia, FYRMadagascarMalawiMalaysiaMaliMaltaMauritaniaMexicoMiddle East & North AfricaMiddle East & North Africa (excluding high income)Middle East & North Africa (IDA & IBRD countries)Middle incomeMoldovaMongoliaMontenegroMoroccoMozambiqueMyanmarNamibiaNepalNicaraguaNigerNigeriaOECD membersOther small statesPakistanPanamaPapua New GuineaParaguayPeruPhilippinesPolandRomaniaRussian FederationRwandaSao Tome and PrincipeSaudi ArabiaSenegalSerbiaSierra LeoneSingaporeSlovak RepublicSloveniaSmall statesSomaliaSouth AfricaSouth AsiaSouth Asia (IDA & IBRD)South SudanSri LankaSub-Saharan Africa Sub-Saharan Africa (excluding high income)Sub-Saharan Africa (IDA & IBRD countries)SudanSurinameSwazilandSyrian Arab RepublicTajikistanTanzaniaThailandTimor-LesteTogoTunisiaTurkeyTurkmenistanUgandaUkraineUnited Arab EmiratesUpper middle incomeUruguayUzbekistanVenezuela, RBVietnamWorldYemen, Rep.ZambiaZimbabwe Zeitlinie:
Diese Zeitleiste vorliegt die Graphik ab 1970 J. bis 2015 J. Tunisia. Die Angaben bis 1969 J. sind nicht vorhanden. Die Zahl aktueller Beobachtungen nach Daten: 32.
Die Quelle (Bezeichnung):
Kennzahlen der Weltentwicklung
Die Quelle (Einrichtung):
Development Assistance Committee of the Organisation for Economic Co-operation and Development, Geographical Distribution of Financial Flows to Developing Countries, Development Co-operation Report, and International Development Statistics database. Data are available online at: www.oecd.org/dac/stats/idsonline.
Kategorien:
Aid Effectiveness
Es wurde aktualisiert:
23 Apr 2017 Jahr
Kennzahlen der Wertänderungen vom Jahr zum Jahr
im Durchschnitt:
407.813 Tsnd.
Minimum:
10.0 Tsnd.
1 Jan 1970 Jahr
Maximum:
5.32 Mln.
1 Jan 2013 Jahr
Zum Datum der Beobachtung
Wert
Absolute Veränderung
Die Veränderung bezüglich dem vorherigen Wert
1 Jan 1970 Jahr
10.0 Tsnd.
+10.0 Tsnd.
0.0%
1 Jan 1982 Jahr
20.0 Tsnd.
+10.0 Tsnd.
100.0%
1 Jan 1983 Jahr
80.0 Tsnd.
+60.0 Tsnd.
300.0%
1 Jan 1984 Jahr
150.0 Tsnd.
+70.0 Tsnd.
87.5%
1 Jan 1985 Jahr
160.0 Tsnd.
+10.0 Tsnd.
6.67%
1 Jan 1986 Jahr
100.0 Tsnd.
-60.0 Tsnd.
-37.5%
1 Jan 1987 Jahr
70.0 Tsnd.
-30.0 Tsnd.
-30.0%
1 Jan 1989 Jahr
80.0 Tsnd.
+10.0 Tsnd.
14.29%
1 Jan 1990 Jahr
90.0 Tsnd.
+10.0 Tsnd.
12.5%
1 Jan 1991 Jahr
80.0 Tsnd.
-10.0 Tsnd.
-11.11%
1 Jan 1992 Jahr
90.0 Tsnd.
+10.0 Tsnd.
12.5%
1 Jan 1993 Jahr
70.0 Tsnd.
-20.0 Tsnd.
-22.22%
1 Jan 1994 Jahr
80.0 Tsnd.
+10.0 Tsnd.
14.29%
1 Jan 1995 Jahr
100.0 Tsnd.
+20.0 Tsnd.
25.0%
1 Jan 1996 Jahr
210.0 Tsnd.
+110.0 Tsnd.
110.0%
1 Jan 1997 Jahr
510.0 Tsnd.
+300.0 Tsnd.
142.86%
1 Jan 1998 Jahr
400.0 Tsnd.
-110.0 Tsnd.
-21.57%
1 Jan 1999 Jahr
230.0 Tsnd.
-170.0 Tsnd.
-42.5%
1 Jan 2000 Jahr
250.0 Tsnd.
+20.0 Tsnd.
8.7%
1 Jan 2001 Jahr
150.0 Tsnd.
-100.0 Tsnd.
-40.0%
1 Jan 2002 Jahr
290.0 Tsnd.
+140.0 Tsnd.
93.33%
1 Jan 2003 Jahr
240.0 Tsnd.
-50.0 Tsnd.
-17.24%
1 Jan 2004 Jahr
140.0 Tsnd.
-100.0 Tsnd.
-41.67%
1 Jan 2005 Jahr
190.0 Tsnd.
+50.0 Tsnd.
35.71%
1 Jan 2006 Jahr
110.0 Tsnd.
-80.0 Tsnd.
-42.11%
1 Jan 2007 Jahr
150.0 Tsnd.
+40.0 Tsnd.
36.36%
1 Jan 2008 Jahr
120.0 Tsnd.
-30.0 Tsnd.
-20.0%
1 Jan 2009 Jahr
320.0 Tsnd.
+200.0 Tsnd.
166.67%
1 Jan 2010 Jahr
270.0 Tsnd.
-50.0 Tsnd.
-15.63%
1 Jan 2011 Jahr
240.0 Tsnd.
-30.0 Tsnd.
-11.11%
1 Jan 2013 Jahr
5.32 Mln.
+5.08 Mln.
2.12 Tsnd.%
1 Jan 2015 Jahr
2.73 Mln.
-2.59 Mln.
-48.68%
Bewertung der Länder gemäß mit laufender Statistik nach Jahren


Kommentare: