30
/de/
AIzaSyAYiBZKx7MnpbEhh9jyipgxe19OcubqV5w
April 1, 2024
267543
Trinidad and Tobago
TTO
true
2
1
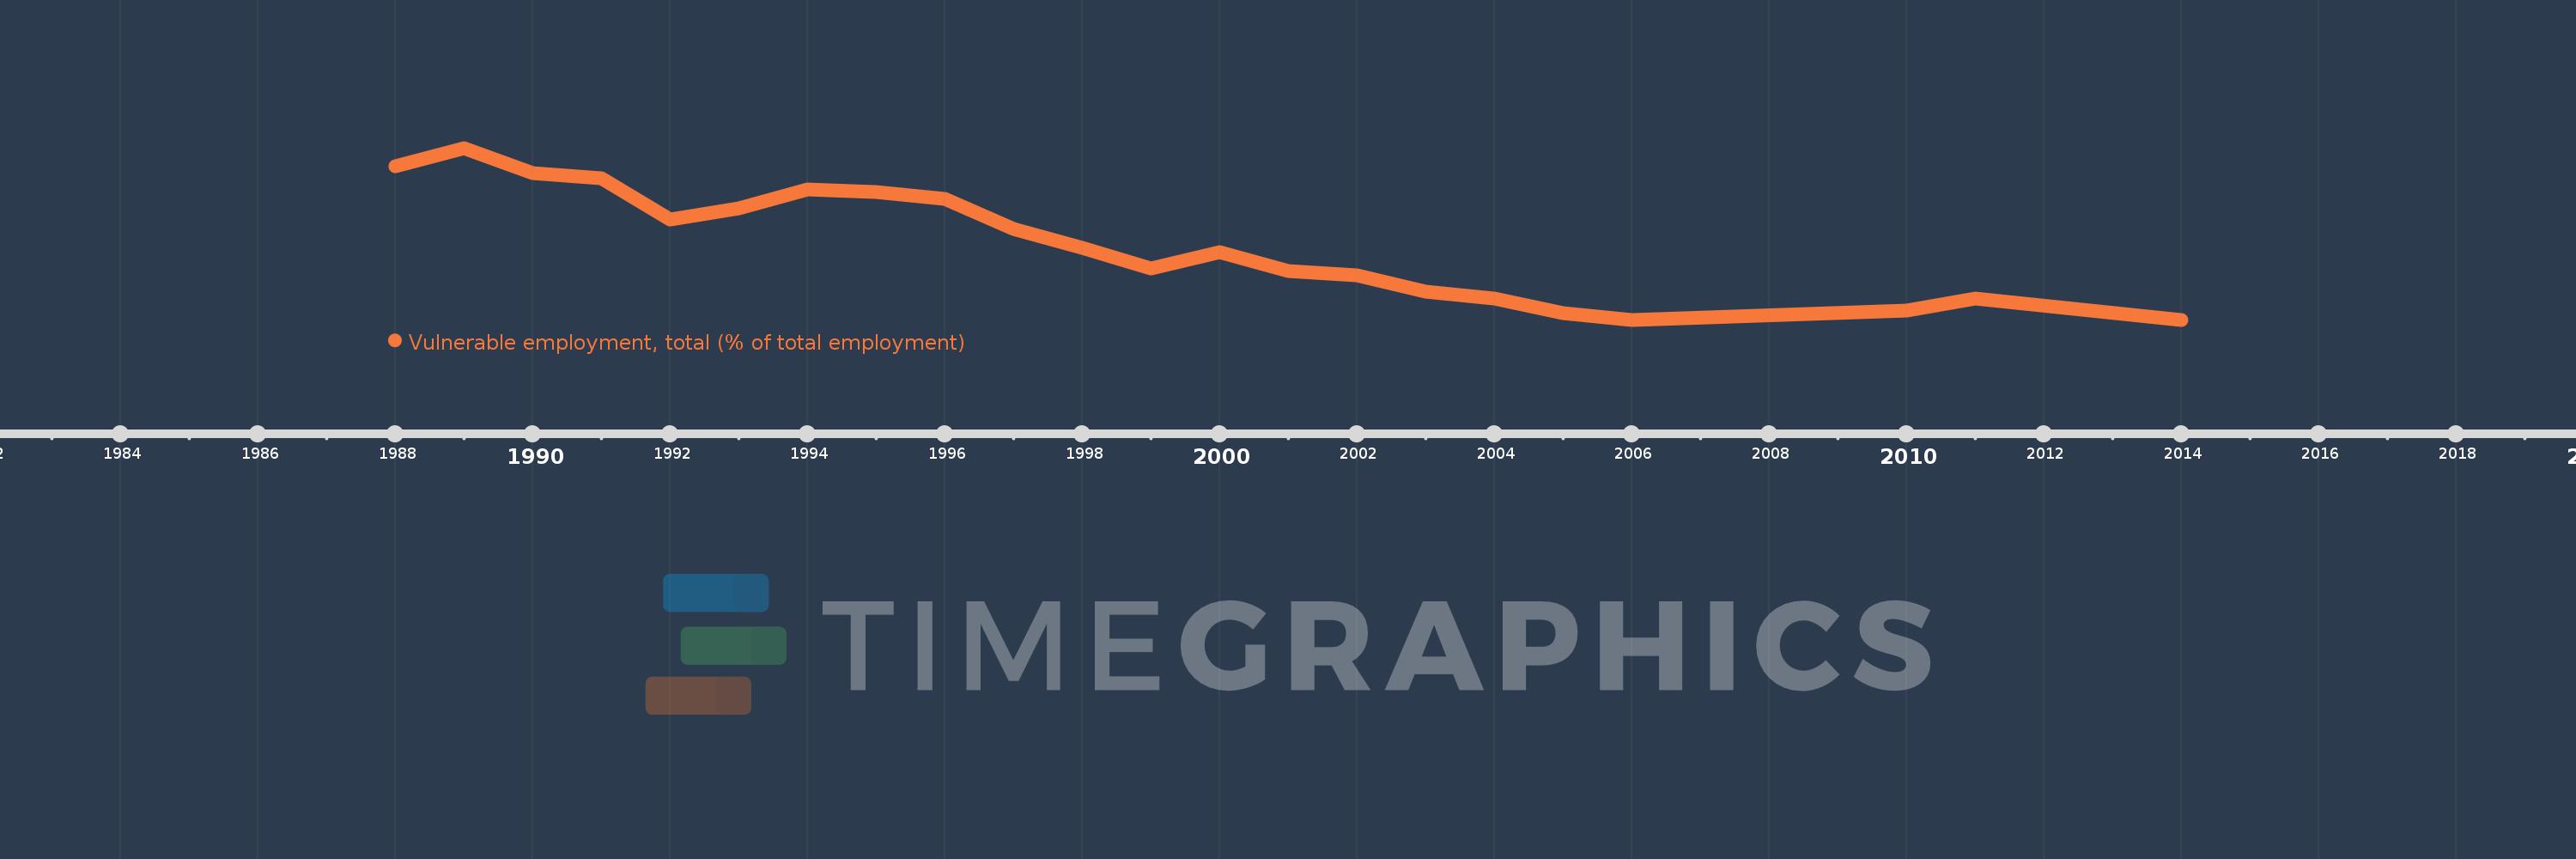
Vulnerable employment, total (% of total employment)
2014,2011,2010,2006,2005,2004,2003,2002,2001,2000,1999,1998,1997,1996,1995,1994,1993,1992,1991,1990,1989,1988
