30
/de/
AIzaSyAYiBZKx7MnpbEhh9jyipgxe19OcubqV5w
April 1, 2024
261519
Tanzania
TZA
true
2
1
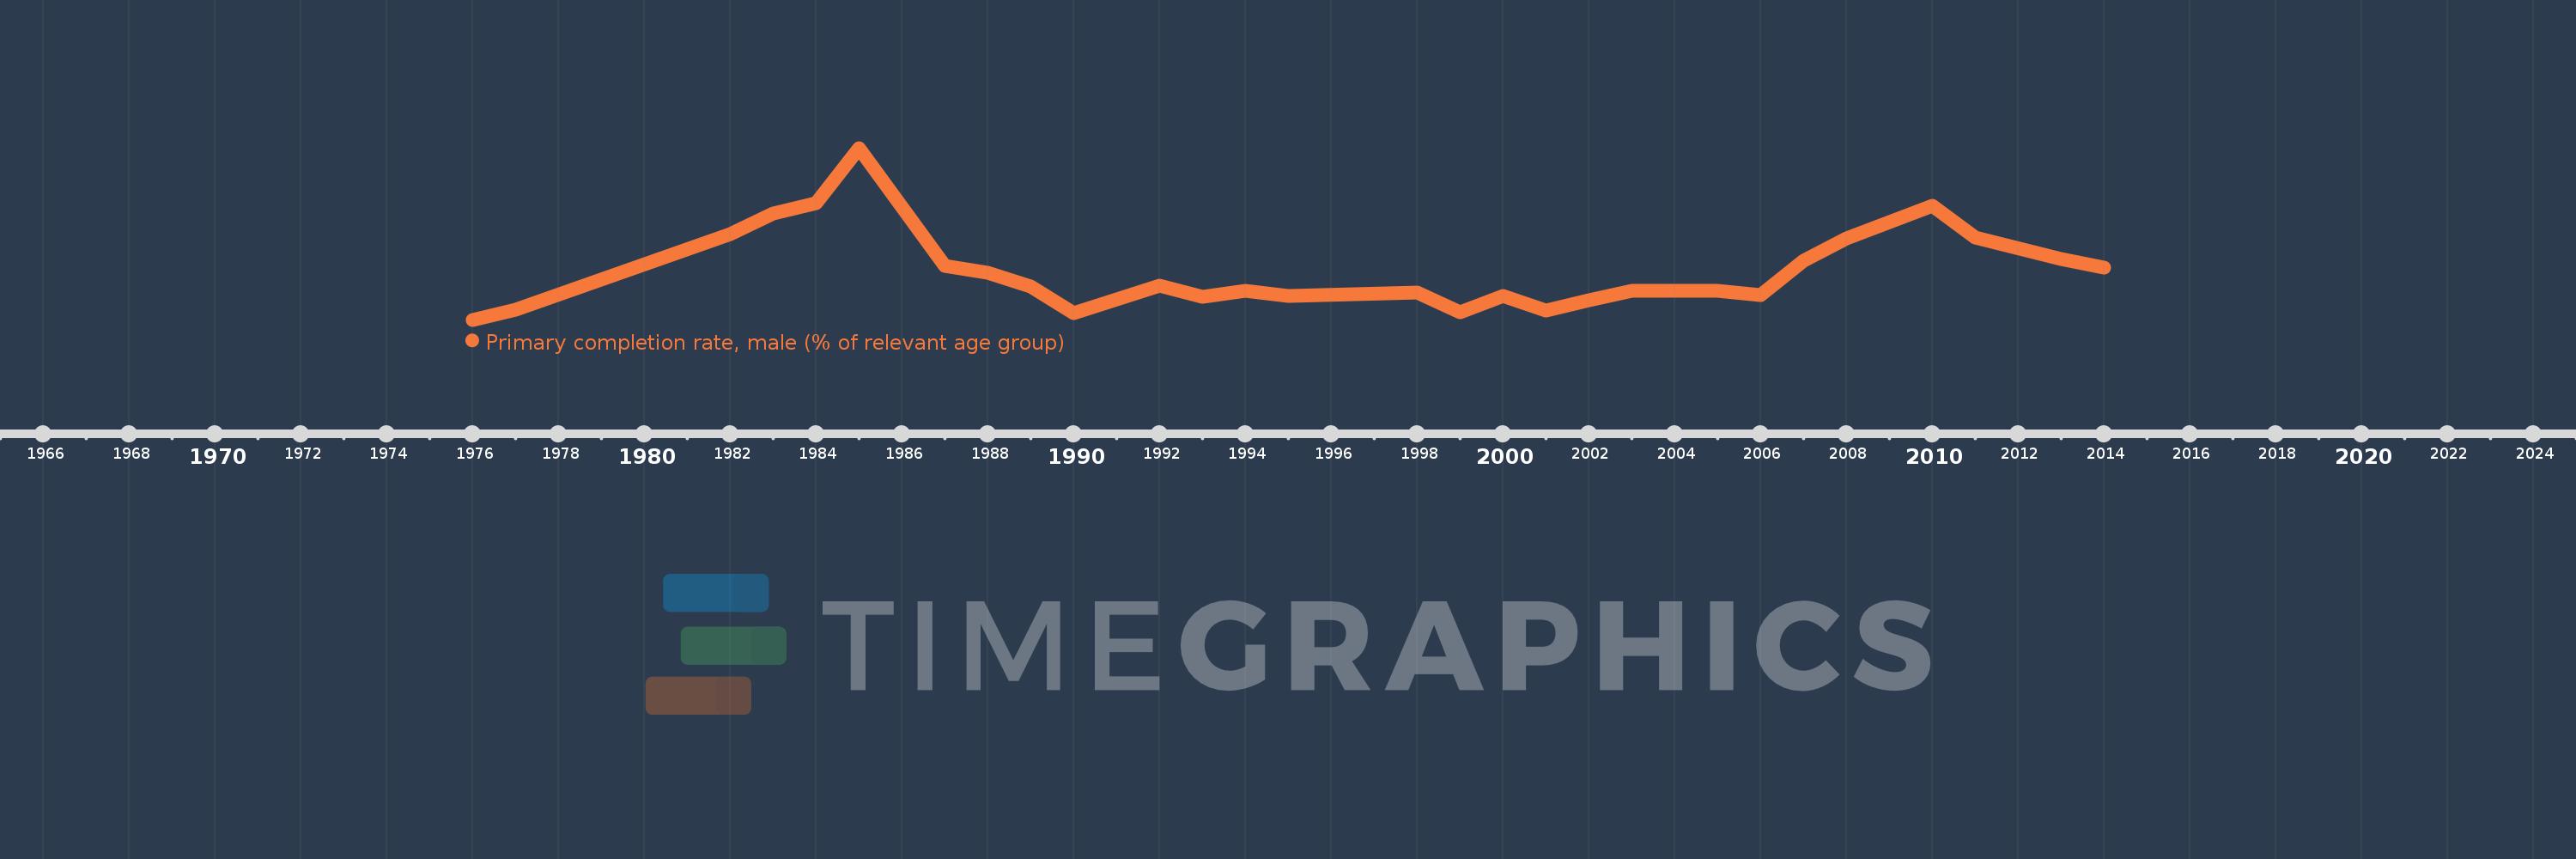
Primary completion rate, male (% of relevant age group)
2014,2013,2011,2010,2008,2007,2006,2005,2003,2002,2001,2000,1999,1998,1995,1994,1993,1992,1990,1989,1988,1987,1985,1984,1983,1982,1977,1976
