29
/de/
de
AIzaSyAYiBZKx7MnpbEhh9jyipgxe19OcubqV5w
April 1, 2024
26113
Central Europe and the Baltics
CEB
false
2
1
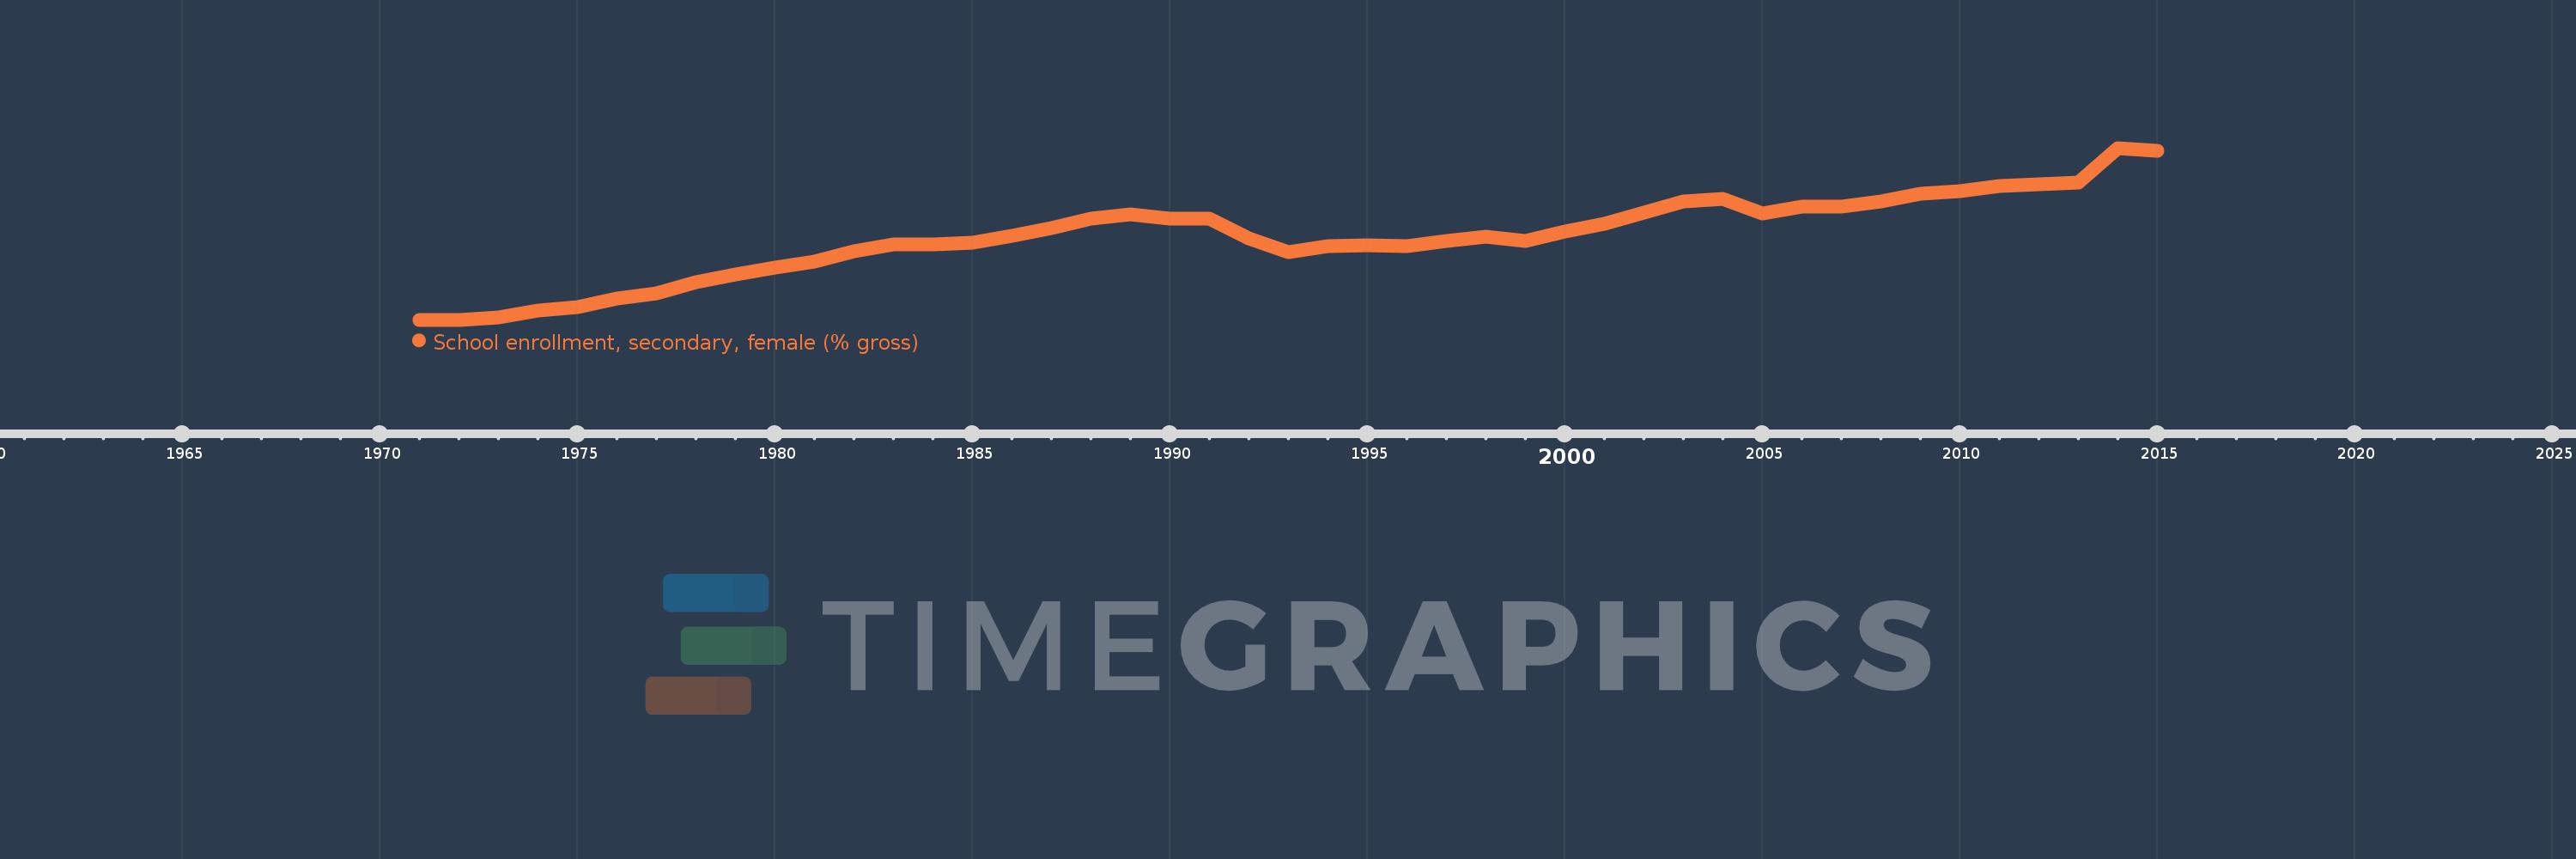
School enrollment, secondary, female (% gross)
2015,2014,2013,2012,2011,2010,2009,2008,2007,2006,2005,2004,2003,2002,2001,2000,1999,1998,1997,1996,1995,1994,1993,1992,1991,1990,1989,1988,1987,1986,1985,1984,1983,1982,1981,1980,1979,1978,1977,1976,1975,1974,1973,1972,1971
Diese Statistik in anderen Ländern:
AfghanistanAlbaniaAlgeriaAndorraAngolaAntigua and BarbudaArab WorldArgentinaArmeniaArubaAustraliaAustriaAzerbaijanBahamas, TheBahrainBangladeshBarbadosBelarusBelgiumBelizeBeninBermudaBhutanBoliviaBosnia and HerzegovinaBotswanaBrazilBrunei DarussalamBulgariaBurkina FasoBurundiCabo VerdeCambodiaCameroonCanadaCaribbean small statesCentral African RepublicCentral Europe and the BalticsChadChileChinaColombiaComorosCongo, Dem. Rep.Congo, Rep.Costa RicaCote d'IvoireCroatiaCubaCuracaoCyprusCzech RepublicDenmarkDjiboutiDominicaDominican RepublicEarly-demographic dividendEast Asia & PacificEast Asia & Pacific (excluding high income)East Asia & Pacific (IDA & IBRD countries)EcuadorEgypt, Arab Rep.El SalvadorEquatorial GuineaEritreaEstoniaEthiopiaEuro areaEurope & Central AsiaEurope & Central Asia (excluding high income)Europe & Central Asia (IDA & IBRD countries)European UnionFijiFinlandFragile and conflict affected situationsFranceGabonGambia, TheGeorgiaGermanyGhanaGreeceGrenadaGuatemalaGuineaGuinea-BissauGuyanaHeavily indebted poor countries (HIPC)High incomeHondurasHong Kong SAR, ChinaHungaryIBRD onlyIcelandIDA & IBRD totalIDA blendIDA onlyIDA totalIndiaIndonesiaIran, Islamic Rep.IraqIrelandIsraelItalyJamaicaJapanJordanKazakhstanKenyaKiribatiKorea, Dem. People’s Rep.Korea, Rep.KuwaitKyrgyz RepublicLao PDRLate-demographic dividendLatin America & Caribbean Latin America & Caribbean (excluding high income)Latin America & the Caribbean (IDA & IBRD countries)LatviaLeast developed countries: UN classificationLebanonLesothoLiberiaLibyaLiechtensteinLithuaniaLow & middle incomeLow incomeLower middle incomeLuxembourgMacao SAR, ChinaMacedonia, FYRMadagascarMalawiMaldivesMaliMaltaMarshall IslandsMauritaniaMauritiusMexicoMicronesia, Fed. Sts.Middle East & North AfricaMiddle East & North Africa (excluding high income)Middle East & North Africa (IDA & IBRD countries)Middle incomeMoldovaMongoliaMontenegroMoroccoMozambiqueMyanmarNamibiaNauruNepalNetherlandsNew ZealandNicaraguaNigerNigeriaNorth AmericaNorwayOECD membersOmanOther small statesPacific island small statesPakistanPalauPanamaPapua New GuineaParaguayPeruPhilippinesPolandPortugalPost-demographic dividendPre-demographic dividendPuerto RicoQatarRomaniaRussian FederationRwandaSamoaSan MarinoSao Tome and PrincipeSaudi ArabiaSenegalSerbiaSeychellesSierra LeoneSlovak RepublicSloveniaSmall statesSolomon IslandsSomaliaSouth AfricaSouth AsiaSouth Asia (IDA & IBRD)SpainSri LankaSt. Kitts and NevisSt. LuciaSt. Vincent and the GrenadinesSub-Saharan Africa Sub-Saharan Africa (excluding high income)Sub-Saharan Africa (IDA & IBRD countries)SudanSurinameSwazilandSwedenSwitzerlandSyrian Arab RepublicTajikistanTanzaniaThailandTimor-LesteTogoTongaTrinidad and TobagoTunisiaTurkeyTurkmenistanTuvaluUgandaUkraineUnited Arab EmiratesUnited KingdomUnited StatesUpper middle incomeUruguayUzbekistanVanuatuVenezuela, RBVietnamWest Bank and GazaWorldYemen, Rep.ZambiaZimbabwe Zeitlinie:
Diese Zeitleiste vorliegt die Graphik ab 1971 J. bis 2015 J. Central Europe and the Baltics. Die Angaben bis 1970 J. sind nicht vorhanden. Die Zahl aktueller Beobachtungen nach Daten: 45.
Die Quelle (Bezeichnung):
Kennzahlen der Weltentwicklung
Die Quelle (Einrichtung):
United Nations Educational, Scientific, and Cultural Organization (UNESCO) Institute for Statistics.
Kategorien:
Education, Gender
Es wurde aktualisiert:
23 Apr 2017 Jahr
Kennzahlen der Wertänderungen vom Jahr zum Jahr
Minimum:
77.304
1 Jan 1971 Jahr
Maximum:
102.698
1 Jan 2014 Jahr
Zum Datum der Beobachtung
Wert
Absolute Veränderung
Die Veränderung bezüglich dem vorherigen Wert
1 Jan 1971 Jahr
77.304
+77.304
0.0%
1 Jan 1972 Jahr
77.325
+0.021
0.03%
1 Jan 1973 Jahr
77.7
+0.375
0.49%
1 Jan 1974 Jahr
78.664
+0.964
1.24%
1 Jan 1975 Jahr
79.206
+0.541
0.69%
1 Jan 1976 Jahr
80.497
+1.291
1.63%
1 Jan 1977 Jahr
81.235
+0.739
0.92%
1 Jan 1978 Jahr
82.883
+1.648
2.03%
1 Jan 1979 Jahr
84.011
+1.128
1.36%
1 Jan 1980 Jahr
85.025
+1.014
1.21%
1 Jan 1981 Jahr
85.936
+0.911
1.07%
1 Jan 1982 Jahr
87.433
+1.497
1.74%
1 Jan 1983 Jahr
88.4
+0.967
1.11%
1 Jan 1984 Jahr
88.402
+0.002
0.0%
1 Jan 1985 Jahr
88.689
+0.287
0.32%
1 Jan 1986 Jahr
89.694
+1.006
1.13%
1 Jan 1987 Jahr
90.816
+1.122
1.25%
1 Jan 1988 Jahr
92.278
+1.462
1.61%
1 Jan 1989 Jahr
92.847
+0.569
0.62%
1 Jan 1990 Jahr
92.232
-0.615
-0.66%
1 Jan 1991 Jahr
92.194
-0.038
-0.04%
1 Jan 1992 Jahr
89.336
-2.858
-3.1%
1 Jan 1993 Jahr
87.338
-1.998
-2.24%
1 Jan 1994 Jahr
88.136
+0.798
0.91%
1 Jan 1995 Jahr
88.329
+0.193
0.22%
1 Jan 1996 Jahr
88.236
-0.092
-0.1%
1 Jan 1997 Jahr
88.995
+0.758
0.86%
1 Jan 1998 Jahr
89.56
+0.566
0.64%
1 Jan 1999 Jahr
88.896
-0.665
-0.74%
1 Jan 2000 Jahr
90.293
+1.397
1.57%
1 Jan 2001 Jahr
91.461
+1.168
1.29%
1 Jan 2002 Jahr
93.152
+1.691
1.85%
1 Jan 2003 Jahr
94.785
+1.633
1.75%
1 Jan 2004 Jahr
95.229
+0.445
0.47%
1 Jan 2005 Jahr
92.971
-2.258
-2.37%
1 Jan 2006 Jahr
93.965
+0.994
1.07%
1 Jan 2007 Jahr
94.014
+0.049
0.05%
1 Jan 2008 Jahr
94.822
+0.808
0.86%
1 Jan 2009 Jahr
95.927
+1.105
1.17%
1 Jan 2010 Jahr
96.283
+0.355
0.37%
1 Jan 2011 Jahr
97.038
+0.756
0.79%
1 Jan 2012 Jahr
97.343
+0.305
0.31%
1 Jan 2013 Jahr
97.528
+0.185
0.19%
1 Jan 2014 Jahr
102.698
+5.171
5.3%
1 Jan 2015 Jahr
102.233
-0.466
-0.45%
Bewertung der Länder gemäß mit laufender Statistik nach Jahren


Kommentare: