29
/de/
de
AIzaSyAYiBZKx7MnpbEhh9jyipgxe19OcubqV5w
April 1, 2024
26094
Central Europe and the Baltics
CEB
false
2
1
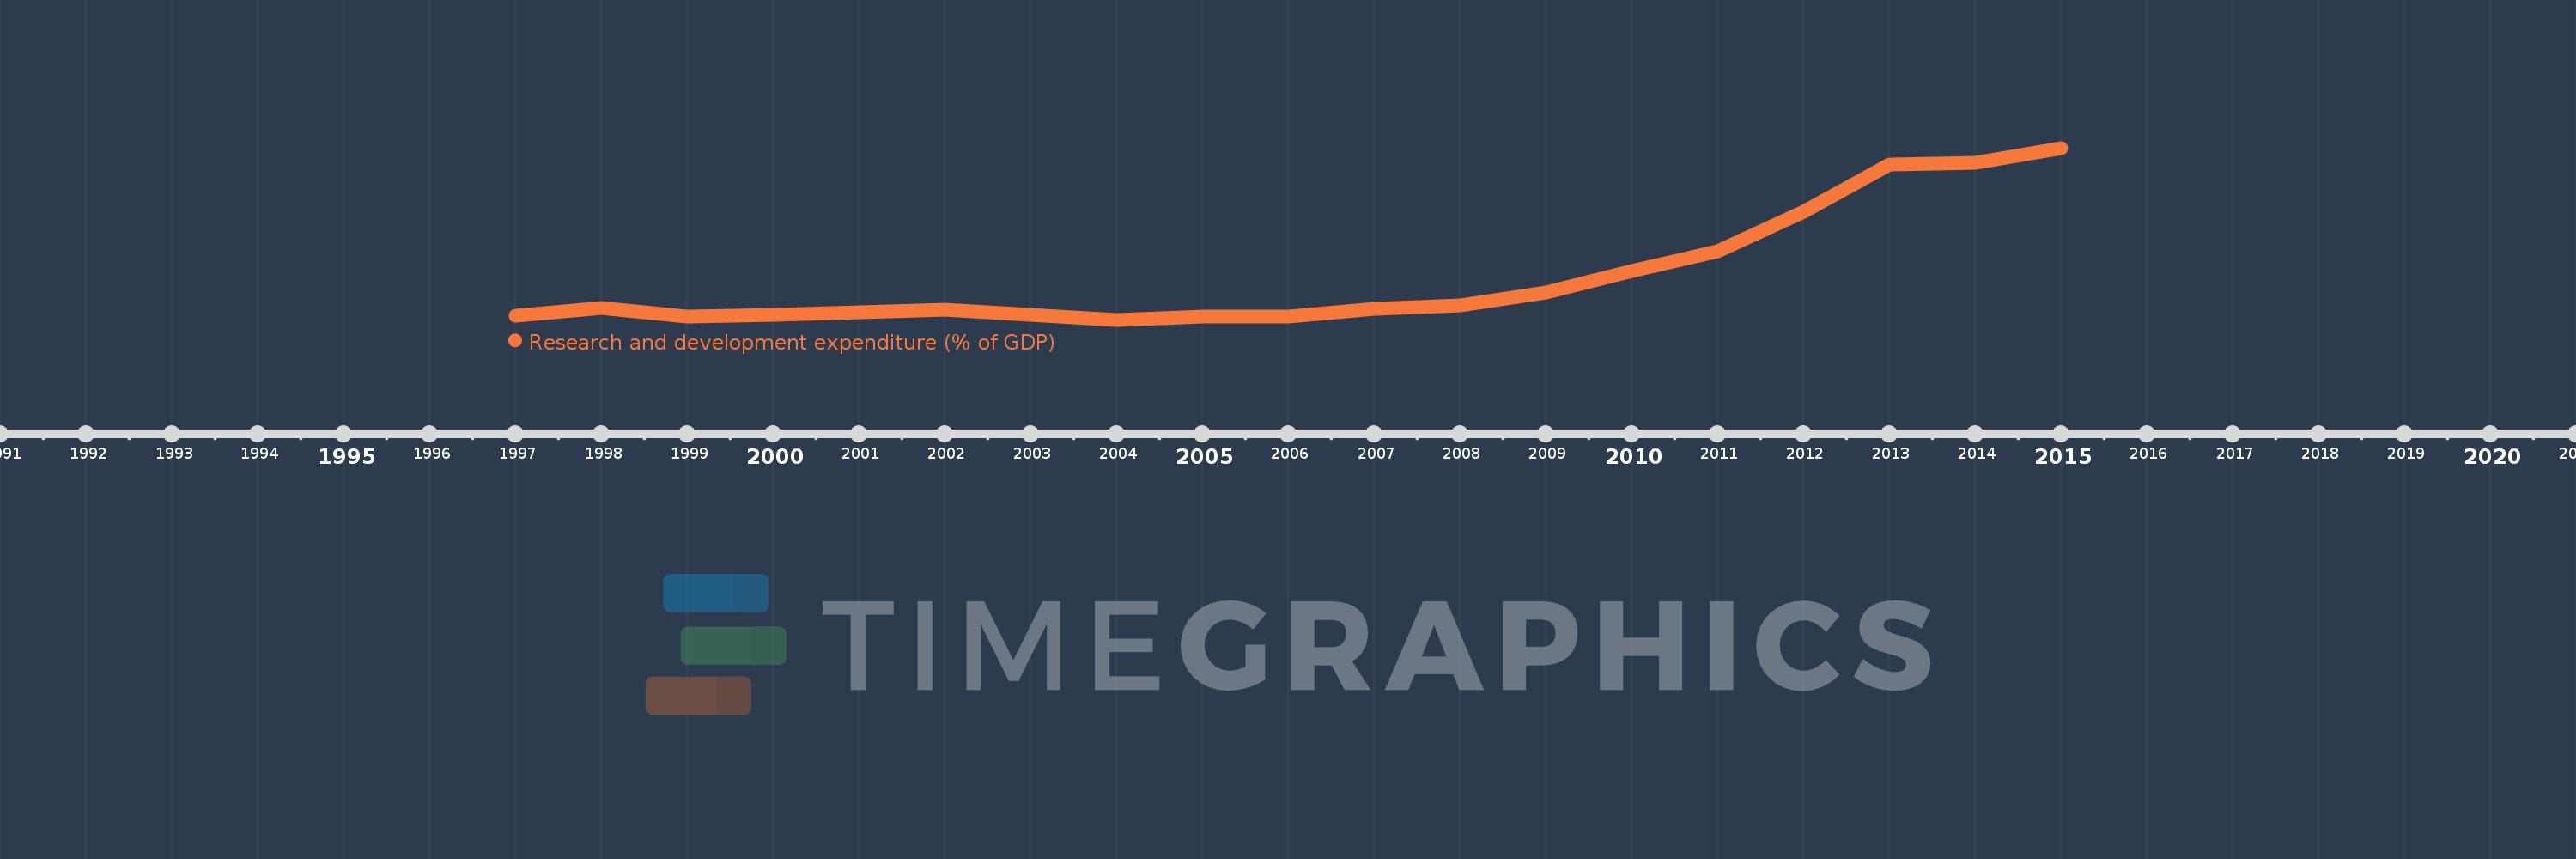
Research and development expenditure (% of GDP)
2015,2014,2013,2012,2011,2010,2009,2008,2007,2006,2005,2004,2003,2002,2001,2000,1999,1998,1997
Diese Statistik in anderen Ländern:
Zeitlinie:
Diese Zeitleiste vorliegt die Graphik ab 1997 J. bis 2015 J. Central Europe and the Baltics. Die Angaben bis 1996 J. sind nicht vorhanden. Die Zahl aktueller Beobachtungen nach Daten: 19.
Die Quelle (Bezeichnung):
Kennzahlen der Weltentwicklung
Die Quelle (Einrichtung):
United Nations Educational, Scientific, and Cultural Organization (UNESCO) Institute for Statistics.
Kategorien:
Science & Technology
Es wurde aktualisiert:
23 Apr 2017 Jahr
Kennzahlen der Wertänderungen vom Jahr zum Jahr
Minimum:
0.73
1 Jan 2004 Jahr
Maximum:
1.095
1 Jan 2015 Jahr
Zum Datum der Beobachtung
Wert
Absolute Veränderung
Die Veränderung bezüglich dem vorherigen Wert
1 Jan 1997 Jahr
0.738
+0.738
0.0%
1 Jan 1998 Jahr
0.755
+0.017
2.3%
1 Jan 1999 Jahr
0.736
-0.019
-2.55%
1 Jan 2000 Jahr
0.741
+0.005
0.7%
1 Jan 2001 Jahr
0.746
+0.005
0.74%
1 Jan 2002 Jahr
0.751
+0.004
0.6%
1 Jan 2003 Jahr
0.74
-0.01
-1.38%
1 Jan 2004 Jahr
0.73
-0.01
-1.35%
1 Jan 2005 Jahr
0.736
+0.006
0.76%
1 Jan 2006 Jahr
0.737
+0.001
0.19%
1 Jan 2007 Jahr
0.753
+0.016
2.17%
1 Jan 2008 Jahr
0.76
+0.006
0.81%
1 Jan 2009 Jahr
0.788
+0.028
3.72%
1 Jan 2010 Jahr
0.834
+0.046
5.89%
1 Jan 2011 Jahr
0.876
+0.042
5.03%
1 Jan 2012 Jahr
0.96
+0.084
9.61%
1 Jan 2013 Jahr
1.06
+0.1
10.43%
1 Jan 2014 Jahr
1.064
+0.004
0.36%
1 Jan 2015 Jahr
1.095
+0.031
2.93%
Bewertung der Länder gemäß mit laufender Statistik nach Jahren


Kommentare: