29
/de/
de
AIzaSyAYiBZKx7MnpbEhh9jyipgxe19OcubqV5w
April 1, 2024
26083
Central Europe and the Baltics
CEB
false
2
1
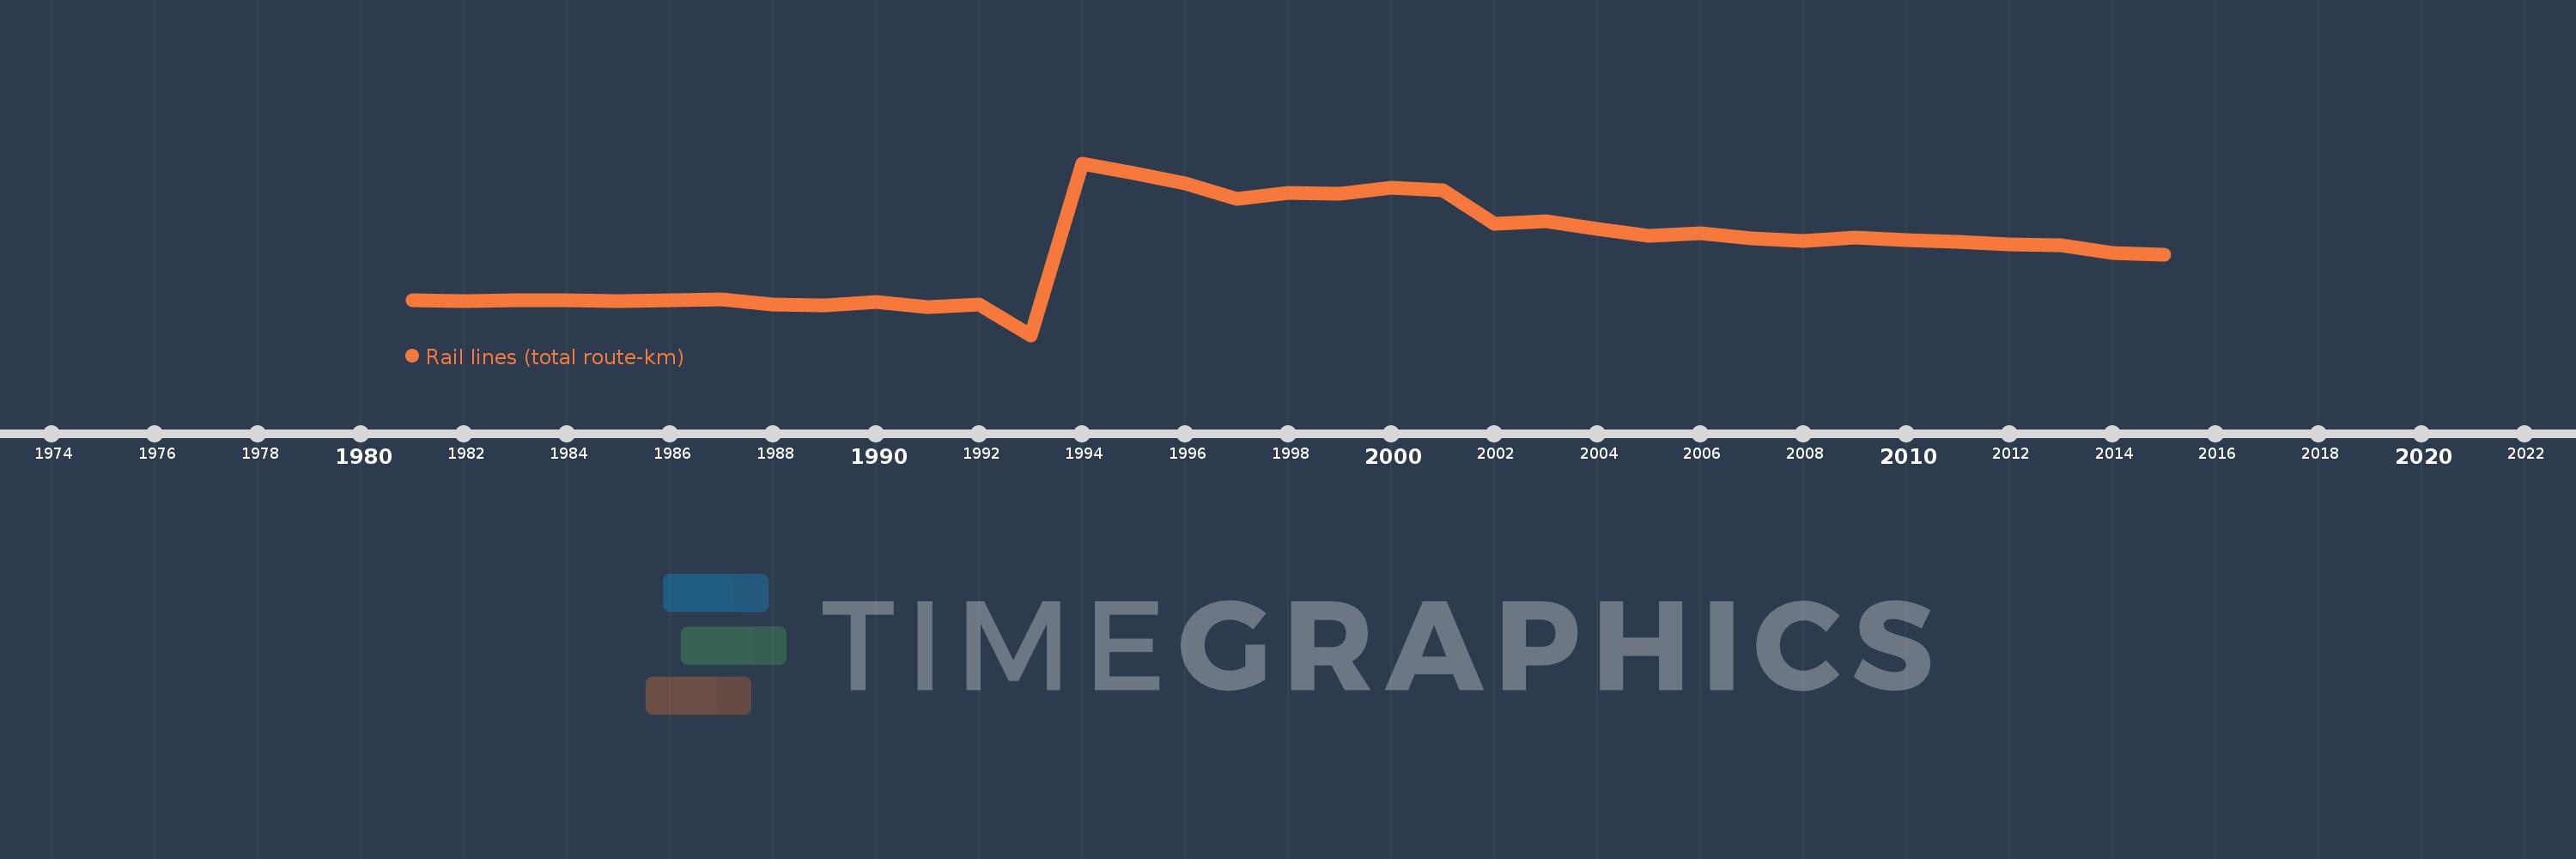
Rail lines (total route-km)
2015,2014,2013,2012,2011,2010,2009,2008,2007,2006,2005,2004,2003,2002,2001,2000,1999,1998,1997,1996,1995,1994,1993,1992,1991,1990,1989,1988,1987,1986,1985,1984,1983,1982,1981
Diese Statistik in anderen Ländern:
Zeitlinie:
Diese Zeitleiste vorliegt die Graphik ab 1981 J. bis 2015 J. Central Europe and the Baltics. Die Angaben bis 1980 J. sind nicht vorhanden. Die Zahl aktueller Beobachtungen nach Daten: 35.
Die Quelle (Bezeichnung):
Kennzahlen der Weltentwicklung
Die Quelle (Einrichtung):
World Bank, Transportation, Water, and Information and Communications Technologies Department, Transport Division.
Kategorien:
Infrastructure
Es wurde aktualisiert:
23 Apr 2017 Jahr
Kennzahlen der Wertänderungen vom Jahr zum Jahr
im Durchschnitt:
63.263 Tsnd.
Minimum:
56.181 Tsnd.
1 Jan 1993 Jahr
Maximum:
70.654 Tsnd.
1 Jan 1994 Jahr
Zum Datum der Beobachtung
Wert
Absolute Veränderung
Die Veränderung bezüglich dem vorherigen Wert
1 Jan 1981 Jahr
59.13 Tsnd.
+59.13 Tsnd.
0.0%
1 Jan 1982 Jahr
59.063 Tsnd.
-66.5
-0.11%
1 Jan 1983 Jahr
59.096 Tsnd.
+33.1
0.06%
1 Jan 1984 Jahr
59.077 Tsnd.
-18.9
-0.03%
1 Jan 1985 Jahr
59.036 Tsnd.
-41.2
-0.07%
1 Jan 1986 Jahr
59.114 Tsnd.
+77.7
0.13%
1 Jan 1987 Jahr
59.153 Tsnd.
+39.4
0.07%
1 Jan 1988 Jahr
58.765 Tsnd.
-388.5
-0.66%
1 Jan 1989 Jahr
58.691 Tsnd.
-74.0
-0.13%
1 Jan 1990 Jahr
58.974 Tsnd.
+283.3
0.48%
1 Jan 1991 Jahr
58.547 Tsnd.
-426.6
-0.72%
1 Jan 1992 Jahr
58.738 Tsnd.
+191.1
0.33%
1 Jan 1993 Jahr
56.181 Tsnd.
-2.558 Tsnd.
-4.35%
1 Jan 1994 Jahr
70.654 Tsnd.
+14.473 Tsnd.
25.76%
1 Jan 1995 Jahr
69.856 Tsnd.
-797.6
-1.13%
1 Jan 1996 Jahr
68.978 Tsnd.
-878.4
-1.26%
1 Jan 1997 Jahr
67.632 Tsnd.
-1.346 Tsnd.
-1.95%
1 Jan 1998 Jahr
68.17 Tsnd.
+538.34
0.8%
1 Jan 1999 Jahr
68.053 Tsnd.
-117.0
-0.17%
1 Jan 2000 Jahr
68.557 Tsnd.
+504.0
0.74%
1 Jan 2001 Jahr
68.408 Tsnd.
-149.0
-0.22%
1 Jan 2002 Jahr
65.573 Tsnd.
-2.835 Tsnd.
-4.14%
1 Jan 2003 Jahr
65.756 Tsnd.
+183.0
0.28%
1 Jan 2004 Jahr
65.141 Tsnd.
-615.0
-0.94%
1 Jan 2005 Jahr
64.524 Tsnd.
-617.0
-0.95%
1 Jan 2006 Jahr
64.728 Tsnd.
+204.0
0.32%
1 Jan 2007 Jahr
64.342 Tsnd.
-386.0
-0.6%
1 Jan 2008 Jahr
64.119 Tsnd.
-223.0
-0.35%
1 Jan 2009 Jahr
64.385 Tsnd.
+266.0
0.41%
1 Jan 2010 Jahr
64.177 Tsnd.
-208.0
-0.32%
1 Jan 2011 Jahr
64.026 Tsnd.
-151.0
-0.24%
1 Jan 2012 Jahr
63.804 Tsnd.
-222.0
-0.35%
1 Jan 2013 Jahr
63.753 Tsnd.
-51.0
-0.08%
1 Jan 2014 Jahr
63.069 Tsnd.
-684.0
-1.07%
1 Jan 2015 Jahr
62.937 Tsnd.
-132.0
-0.21%
Bewertung der Länder gemäß mit laufender Statistik nach Jahren


Kommentare: