29
/de/
de
AIzaSyAYiBZKx7MnpbEhh9jyipgxe19OcubqV5w
April 1, 2024
260633
Tanzania
TZA
true
2
1
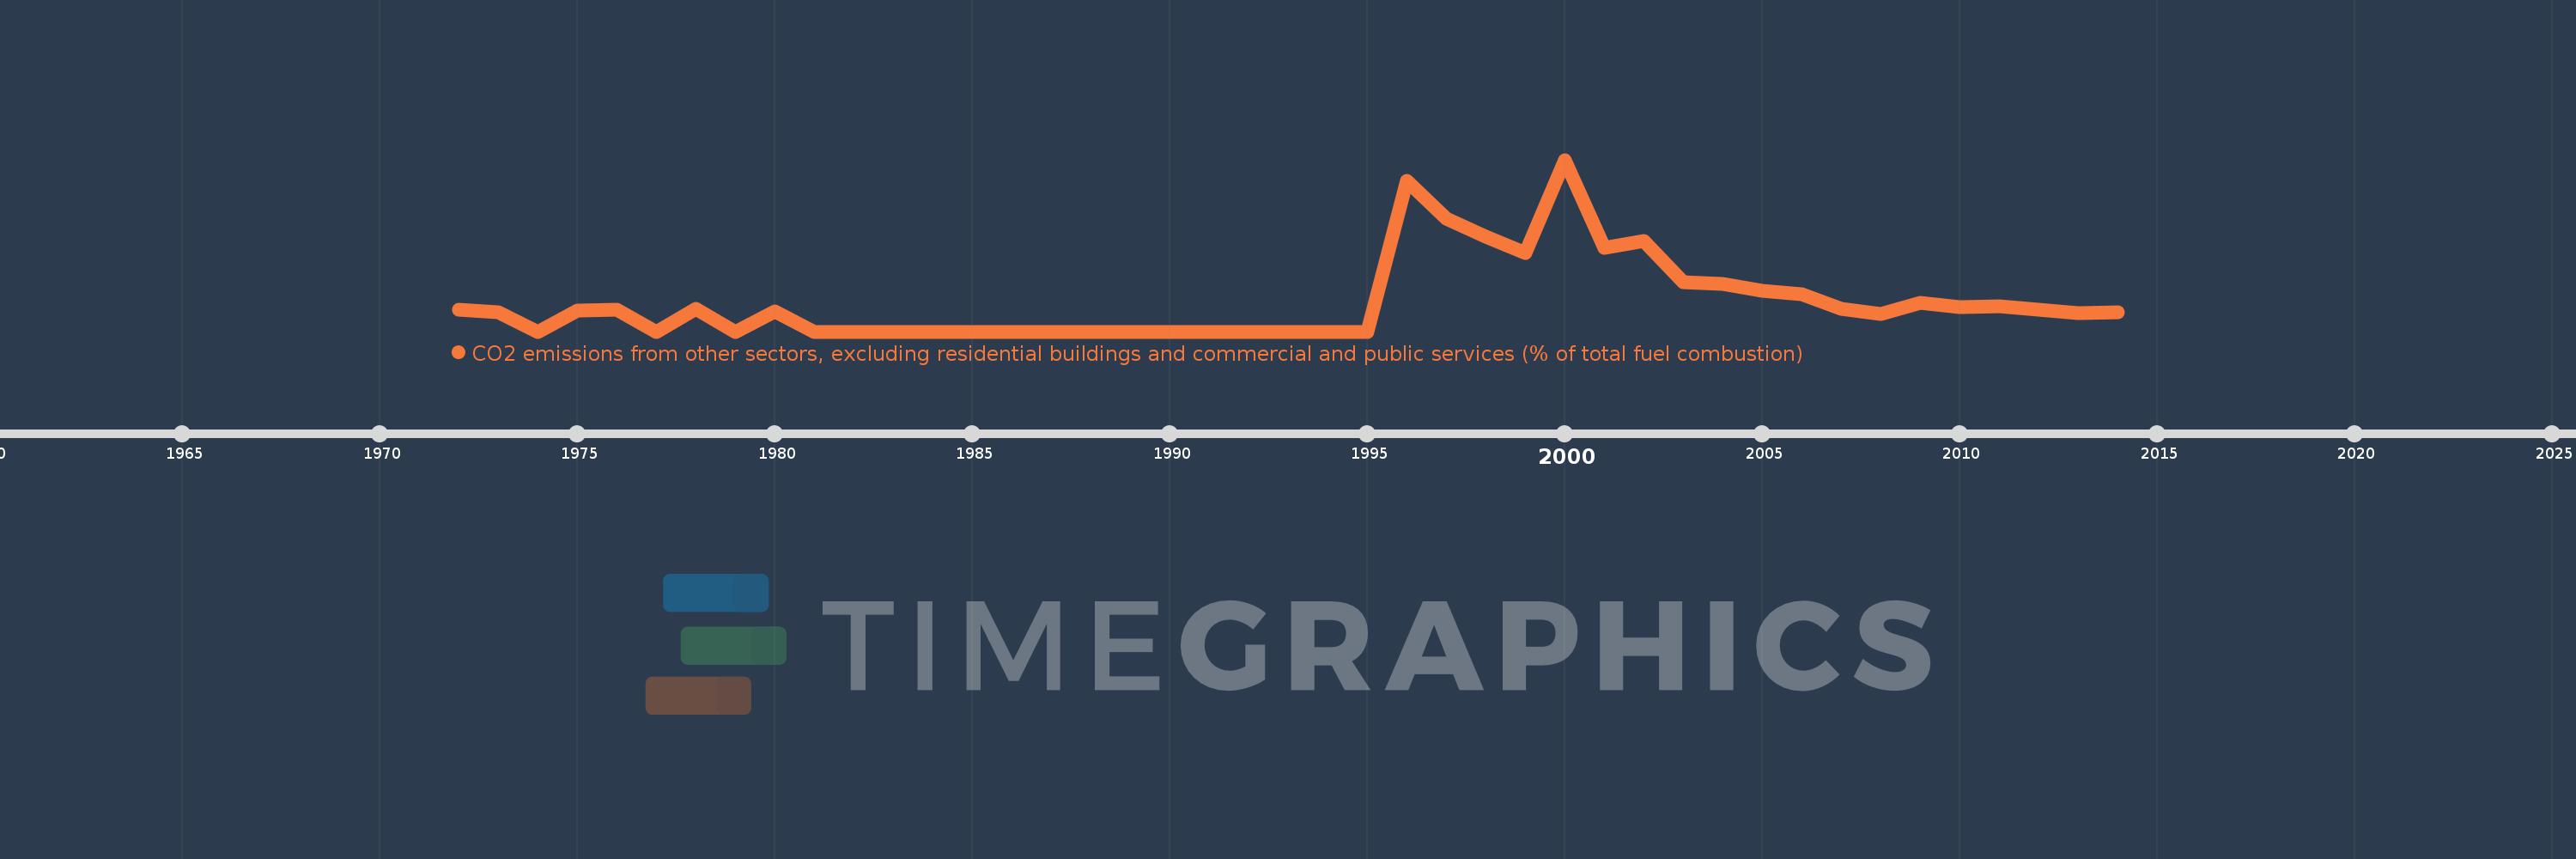
CO2 emissions from other sectors, excluding residential buildings and commercial and public services (% of total fuel combustion)
2014,2013,2012,2011,2010,2009,2008,2007,2006,2005,2004,2003,2002,2001,2000,1999,1998,1997,1996,1995,1994,1993,1992,1991,1990,1989,1988,1987,1986,1985,1984,1983,1982,1981,1980,1979,1978,1977,1976,1975,1974,1973,1972
Diese Statistik in anderen Ländern:
AlbaniaAlgeriaAngolaArab WorldArgentinaArmeniaAustraliaAustriaAzerbaijanBahrainBangladeshBelarusBelgiumBeninBoliviaBosnia and HerzegovinaBotswanaBrazilBrunei DarussalamBulgariaCambodiaCameroonCanadaCaribbean small statesCentral Europe and the BalticsChileChinaColombiaCongo, Dem. Rep.Congo, Rep.Costa RicaCote d'IvoireCroatiaCubaCuracaoCyprusCzech RepublicDenmarkDominican RepublicEarly-demographic dividendEast Asia & PacificEast Asia & Pacific (excluding high income)East Asia & Pacific (IDA & IBRD countries)EcuadorEgypt, Arab Rep.El SalvadorEritreaEstoniaEthiopiaEuro areaEurope & Central AsiaEurope & Central Asia (excluding high income)Europe & Central Asia (IDA & IBRD countries)European UnionFinlandFragile and conflict affected situationsFranceGabonGeorgiaGermanyGhanaGibraltarGreeceGuatemalaHaitiHeavily indebted poor countries (HIPC)High incomeHondurasHong Kong SAR, ChinaHungaryIBRD onlyIcelandIDA & IBRD totalIDA blendIDA onlyIDA totalIndiaIndonesiaIran, Islamic Rep.IraqIrelandIsraelItalyJamaicaJapanJordanKazakhstanKenyaKorea, Dem. People’s Rep.Korea, Rep.KosovoKuwaitKyrgyz RepublicLate-demographic dividendLatin America & Caribbean Latin America & Caribbean (excluding high income)Latin America & the Caribbean (IDA & IBRD countries)LatviaLeast developed countries: UN classificationLebanonLibyaLithuaniaLow & middle incomeLow incomeLower middle incomeLuxembourgMacedonia, FYRMalaysiaMaltaMauritiusMexicoMiddle East & North AfricaMiddle East & North Africa (excluding high income)Middle East & North Africa (IDA & IBRD countries)Middle incomeMoldovaMongoliaMontenegroMoroccoMozambiqueMyanmarNamibiaNepalNetherlandsNew ZealandNicaraguaNigerNigeriaNorth AmericaNorwayOECD membersOmanOther small statesPakistanPanamaParaguayPeruPhilippinesPolandPortugalPost-demographic dividendPre-demographic dividendQatarRomaniaRussian FederationSaudi ArabiaSenegalSerbiaSingaporeSlovak RepublicSloveniaSmall statesSouth AfricaSouth AsiaSouth Asia (IDA & IBRD)South SudanSpainSri LankaSub-Saharan Africa Sub-Saharan Africa (excluding high income)Sub-Saharan Africa (IDA & IBRD countries)SudanSwedenSwitzerlandSyrian Arab RepublicTajikistanTanzaniaThailandTogoTrinidad and TobagoTunisiaTurkeyTurkmenistanUkraineUnited Arab EmiratesUnited KingdomUnited StatesUpper middle incomeUruguayUzbekistanVenezuela, RBVietnamWorldYemen, Rep.ZambiaZimbabwe Zeitlinie:
Diese Zeitleiste vorliegt die Graphik ab 1972 J. bis 2014 J. Tanzania. Die Angaben bis 1971 J. sind nicht vorhanden. Die Zahl aktueller Beobachtungen nach Daten: 43.
Die Quelle (Bezeichnung):
Kennzahlen der Weltentwicklung
Die Quelle (Einrichtung):
IEA Statistics © OECD/IEA 2014 (http://www.iea.org/stats/index.asp), subject to https://www.iea.org/t&c/termsandconditions/
Kategorien:
Environment
Es wurde aktualisiert:
23 Apr 2017 Jahr
Kennzahlen der Wertänderungen vom Jahr zum Jahr
Minimum:
0.0
1 Jan 1974 Jahr
Maximum:
5.505
1 Jan 2000 Jahr
Zum Datum der Beobachtung
Wert
Absolute Veränderung
Die Veränderung bezüglich dem vorherigen Wert
1 Jan 1972 Jahr
0.714
+0.714
0.0%
1 Jan 1973 Jahr
0.61
-0.105
-14.63%
1 Jan 1974 Jahr
0.0
-0.61
-100.0%
1 Jan 1975 Jahr
0.667
+0.667
%
1 Jan 1976 Jahr
0.714
+0.048
7.14%
1 Jan 1977 Jahr
0.0
-0.714
-100.0%
1 Jan 1978 Jahr
0.719
+0.719
%
1 Jan 1979 Jahr
0.0
-0.719
-100.0%
1 Jan 1980 Jahr
0.658
+0.658
%
1 Jan 1981 Jahr
0.0
-0.658
-100.0%
1 Jan 1996 Jahr
4.819
+4.819
%
1 Jan 1997 Jahr
3.61
-1.209
-25.09%
1 Jan 1998 Jahr
3.042
-0.568
-15.74%
1 Jan 1999 Jahr
2.521
-0.521
-17.12%
1 Jan 2000 Jahr
5.505
+2.984
118.35%
1 Jan 2001 Jahr
2.682
-2.823
-51.28%
1 Jan 2002 Jahr
2.899
+0.217
8.07%
1 Jan 2003 Jahr
1.587
-1.311
-45.24%
1 Jan 2004 Jahr
1.52
-0.068
-4.26%
1 Jan 2005 Jahr
1.313
-0.207
-13.61%
1 Jan 2006 Jahr
1.188
-0.125
-9.5%
1 Jan 2007 Jahr
0.734
-0.454
-38.23%
1 Jan 2008 Jahr
0.574
-0.16
-21.85%
1 Jan 2009 Jahr
0.923
+0.349
60.82%
1 Jan 2010 Jahr
0.784
-0.138
-14.98%
1 Jan 2011 Jahr
0.816
+0.031
4.0%
1 Jan 2012 Jahr
0.708
-0.107
-13.17%
1 Jan 2013 Jahr
0.59
-0.118
-16.65%
1 Jan 2014 Jahr
0.619
+0.028
4.78%
Bewertung der Länder gemäß mit laufender Statistik nach Jahren


Kommentare: