29
/de/
de
AIzaSyAYiBZKx7MnpbEhh9jyipgxe19OcubqV5w
April 1, 2024
257714
Switzerland
CHE
true
2
1
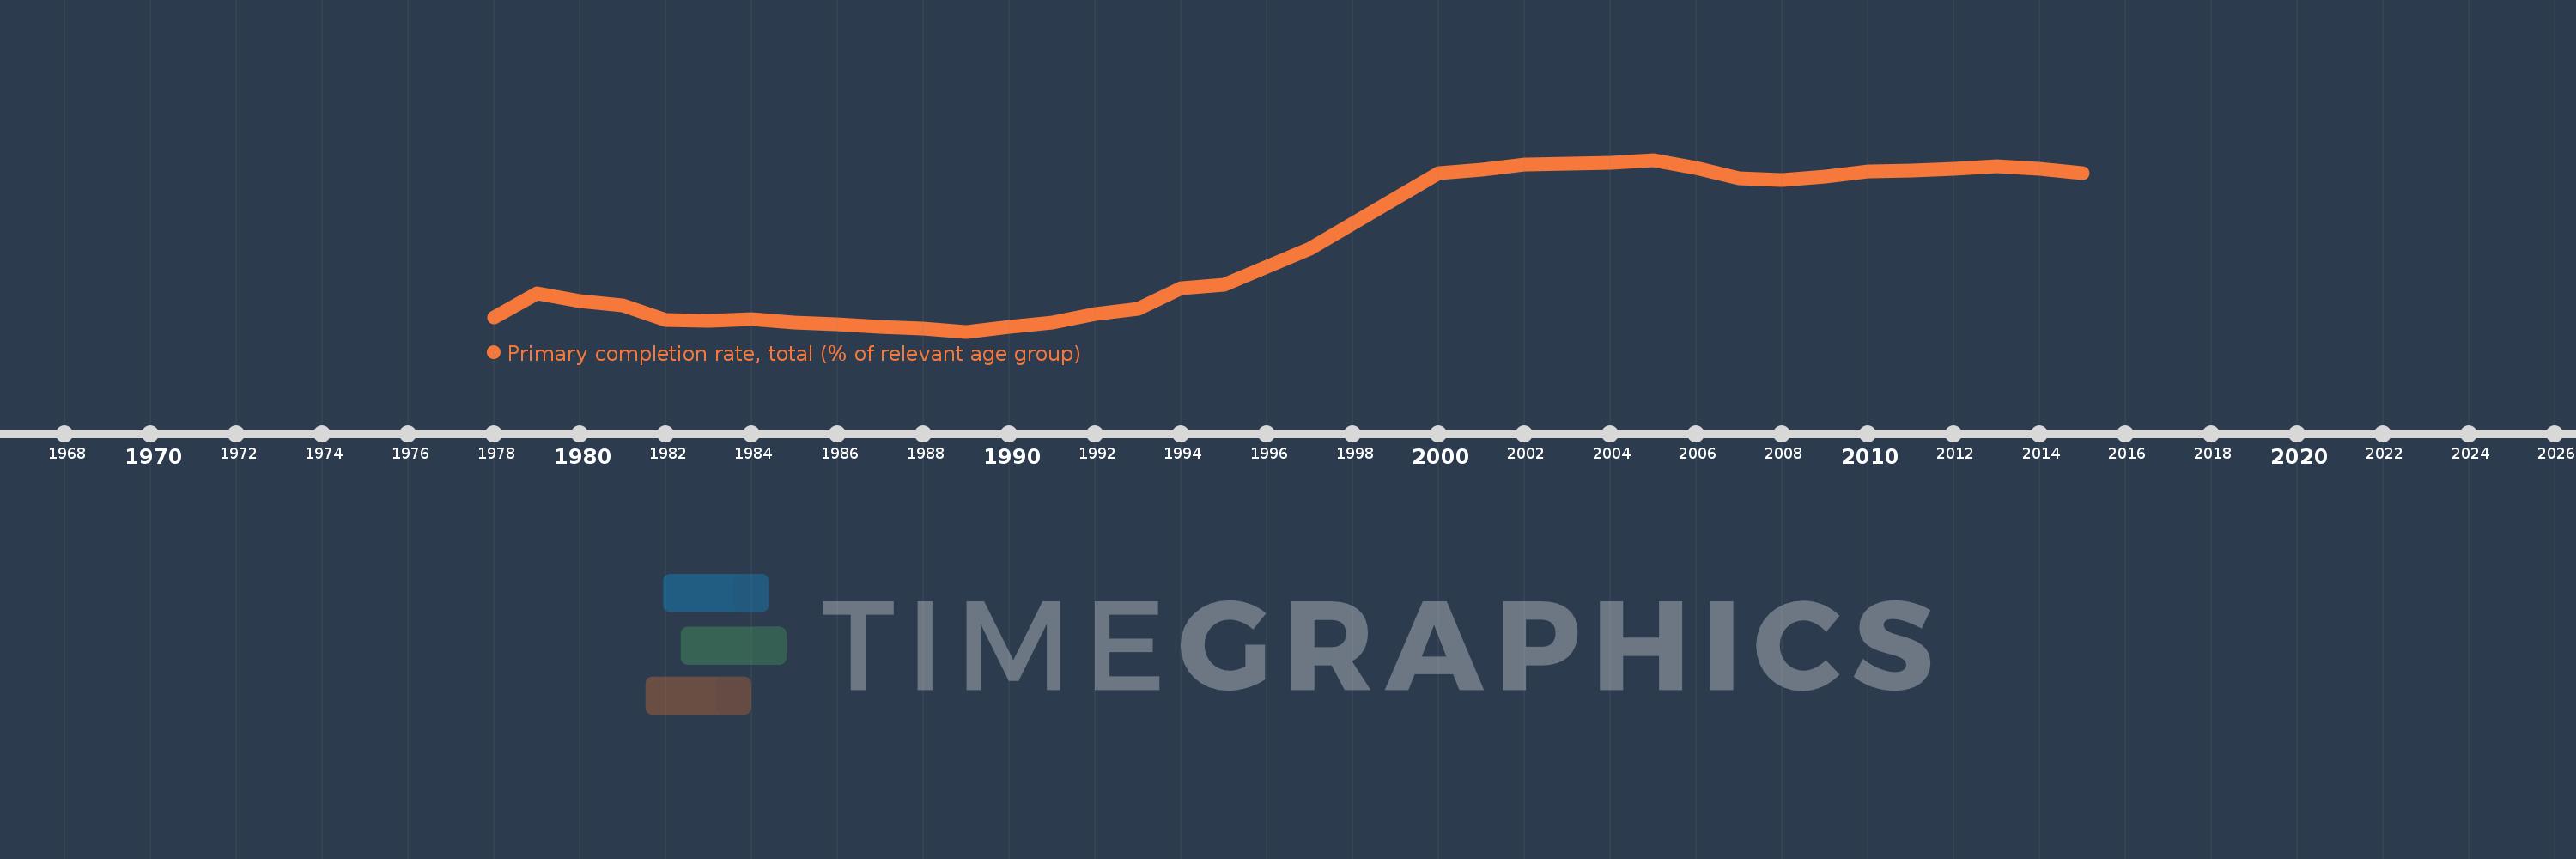
Primary completion rate, total (% of relevant age group)
2015,2014,2013,2012,2011,2010,2009,2008,2007,2006,2005,2004,2003,2002,2001,2000,1997,1995,1994,1993,1992,1991,1990,1989,1988,1987,1986,1985,1984,1983,1982,1981,1980,1979,1978
Diese Statistik in anderen Ländern:
AfghanistanAlbaniaAlgeriaAngolaAntigua and BarbudaArab WorldArgentinaArmeniaArubaAustriaAzerbaijanBahamas, TheBahrainBangladeshBarbadosBelarusBelgiumBelizeBeninBermudaBhutanBoliviaBosnia and HerzegovinaBotswanaBrazilBritish Virgin IslandsBrunei DarussalamBulgariaBurkina FasoBurundiCabo VerdeCambodiaCameroonCanadaCaribbean small statesCentral African RepublicCentral Europe and the BalticsChadChileChinaColombiaComorosCongo, Dem. Rep.Congo, Rep.Costa RicaCote d'IvoireCroatiaCubaCyprusCzech RepublicDenmarkDjiboutiDominicaDominican RepublicEarly-demographic dividendEast Asia & PacificEast Asia & Pacific (excluding high income)East Asia & Pacific (IDA & IBRD countries)EcuadorEgypt, Arab Rep.El SalvadorEquatorial GuineaEritreaEstoniaEthiopiaEuro areaEurope & Central AsiaEurope & Central Asia (excluding high income)Europe & Central Asia (IDA & IBRD countries)European UnionFijiFinlandFragile and conflict affected situationsFranceGabonGambia, TheGeorgiaGermanyGhanaGreeceGrenadaGuatemalaGuineaGuinea-BissauGuyanaHaitiHeavily indebted poor countries (HIPC)High incomeHondurasHong Kong SAR, ChinaHungaryIBRD onlyIcelandIDA & IBRD totalIDA blendIDA onlyIDA totalIndiaIndonesiaIran, Islamic Rep.IraqIrelandIsraelItalyJamaicaJapanJordanKazakhstanKenyaKiribatiKorea, Dem. People’s Rep.Korea, Rep.KuwaitKyrgyz RepublicLao PDRLate-demographic dividendLatin America & Caribbean Latin America & Caribbean (excluding high income)Latin America & the Caribbean (IDA & IBRD countries)LatviaLeast developed countries: UN classificationLebanonLesothoLiberiaLibyaLiechtensteinLithuaniaLow & middle incomeLow incomeLower middle incomeLuxembourgMacao SAR, ChinaMacedonia, FYRMadagascarMalawiMalaysiaMaldivesMaliMaltaMarshall IslandsMauritaniaMauritiusMexicoMiddle East & North AfricaMiddle East & North Africa (excluding high income)Middle East & North Africa (IDA & IBRD countries)Middle incomeMoldovaMongoliaMontenegroMoroccoMozambiqueMyanmarNamibiaNauruNepalNetherlandsNew ZealandNicaraguaNigerNigeriaNorwayOECD membersOmanOther small statesPacific island small statesPakistanPalauPanamaPapua New GuineaParaguayPeruPhilippinesPolandPortugalPost-demographic dividendPre-demographic dividendQatarRomaniaRussian FederationRwandaSamoaSan MarinoSao Tome and PrincipeSaudi ArabiaSenegalSerbiaSeychellesSierra LeoneSlovak RepublicSloveniaSmall statesSolomon IslandsSouth AfricaSouth AsiaSouth Asia (IDA & IBRD)South SudanSpainSri LankaSt. Kitts and NevisSt. LuciaSt. Vincent and the GrenadinesSub-Saharan Africa Sub-Saharan Africa (excluding high income)Sub-Saharan Africa (IDA & IBRD countries)SudanSurinameSwazilandSwedenSwitzerlandSyrian Arab RepublicTajikistanTanzaniaThailandTimor-LesteTogoTongaTrinidad and TobagoTunisiaTurkeyTuvaluUgandaUkraineUnited Arab EmiratesUpper middle incomeUruguayUzbekistanVanuatuVenezuela, RBVietnamWest Bank and GazaWorldYemen, Rep.ZambiaZimbabwe Zeitlinie:
Diese Zeitleiste vorliegt die Graphik ab 1978 J. bis 2015 J. Switzerland. Die Angaben bis 1977 J. sind nicht vorhanden. Die Zahl aktueller Beobachtungen nach Daten: 35.
Die Quelle (Bezeichnung):
Kennzahlen der Weltentwicklung
Die Quelle (Einrichtung):
United Nations Educational, Scientific, and Cultural Organization (UNESCO) Institute for Statistics.
Kategorien:
Aid Effectiveness, Climate Change, Education
Es wurde aktualisiert:
23 Apr 2017 Jahr
Kennzahlen der Wertänderungen vom Jahr zum Jahr
Minimum:
48.47
1 Jan 1989 Jahr
Maximum:
99.168
1 Jan 2005 Jahr
Zum Datum der Beobachtung
Wert
Absolute Veränderung
Die Veränderung bezüglich dem vorherigen Wert
1 Jan 1978 Jahr
52.705
+52.705
0.0%
1 Jan 1979 Jahr
59.781
+7.076
13.43%
1 Jan 1980 Jahr
57.563
-2.217
-3.71%
1 Jan 1981 Jahr
56.153
-1.411
-2.45%
1 Jan 1982 Jahr
51.996
-4.157
-7.4%
1 Jan 1983 Jahr
51.699
-0.297
-0.57%
1 Jan 1984 Jahr
52.039
+0.34
0.66%
1 Jan 1985 Jahr
51.206
-0.833
-1.6%
1 Jan 1986 Jahr
50.698
-0.508
-0.99%
1 Jan 1987 Jahr
49.852
-0.845
-1.67%
1 Jan 1988 Jahr
49.415
-0.437
-0.88%
1 Jan 1989 Jahr
48.47
-0.946
-1.91%
1 Jan 1990 Jahr
49.87
+1.4
2.89%
1 Jan 1991 Jahr
51.245
+1.375
2.76%
1 Jan 1992 Jahr
53.617
+2.371
4.63%
1 Jan 1993 Jahr
55.176
+1.559
2.91%
1 Jan 1994 Jahr
61.21
+6.034
10.94%
1 Jan 1995 Jahr
62.282
+1.072
1.75%
1 Jan 1997 Jahr
72.97
+10.688
17.16%
1 Jan 2000 Jahr
95.337
+22.367
30.65%
1 Jan 2001 Jahr
96.376
+1.038
1.09%
1 Jan 2002 Jahr
97.737
+1.361
1.41%
1 Jan 2003 Jahr
97.968
+0.232
0.24%
1 Jan 2004 Jahr
98.187
+0.219
0.22%
1 Jan 2005 Jahr
99.168
+0.981
1.0%
1 Jan 2006 Jahr
96.721
-2.447
-2.47%
1 Jan 2007 Jahr
93.705
-3.016
-3.12%
1 Jan 2008 Jahr
93.121
-0.584
-0.62%
1 Jan 2009 Jahr
94.157
+1.036
1.11%
1 Jan 2010 Jahr
95.852
+1.695
1.8%
1 Jan 2011 Jahr
95.941
+0.09
0.09%
1 Jan 2012 Jahr
96.412
+0.47
0.49%
1 Jan 2013 Jahr
97.169
+0.757
0.79%
1 Jan 2014 Jahr
96.62
-0.549
-0.57%
1 Jan 2015 Jahr
95.35
-1.27
-1.31%
Bewertung der Länder gemäß mit laufender Statistik nach Jahren


Kommentare: