29
/de/
de
AIzaSyAYiBZKx7MnpbEhh9jyipgxe19OcubqV5w
April 1, 2024
256242
Sweden
SWE
true
2
1
Employment in services, male (% of male employment)
2015,2014,2013,2012,2011,2010,2009,2008,2007,2006,2005,2004,2003,2002,2001,2000,1999,1998,1997,1996,1995,1994,1993,1992,1991,1990,1989,1988,1987,1986,1985,1984,1983,1982,1981
Diese Statistik in anderen Ländern:
AlbaniaAlgeriaAmerican SamoaAntigua and BarbudaArab WorldArgentinaArmeniaArubaAustraliaAustriaAzerbaijanBahamas, TheBahrainBangladeshBarbadosBelarusBelgiumBelizeBeninBermudaBhutanBoliviaBotswanaBrazilBritish Virgin IslandsBrunei DarussalamBulgariaBurkina FasoBurundiCambodiaCameroonCanadaCaribbean small statesCayman IslandsCentral Europe and the BalticsChadChileChinaColombiaCongo, Rep.Costa RicaCroatiaCubaCyprusCzech RepublicDenmarkDominicaDominican RepublicEarly-demographic dividendEast Asia & PacificEast Asia & Pacific (excluding high income)East Asia & Pacific (IDA & IBRD countries)EcuadorEgypt, Arab Rep.El SalvadorEquatorial GuineaEstoniaEthiopiaEuro areaEurope & Central AsiaEurope & Central Asia (excluding high income)Europe & Central Asia (IDA & IBRD countries)European UnionFaroe IslandsFijiFinlandFranceGabonGambia, TheGeorgiaGermanyGhanaGreeceGreenlandGrenadaGuatemalaGuineaGuyanaHaitiHigh incomeHondurasHong Kong SAR, ChinaHungaryIBRD onlyIcelandIDA & IBRD totalIDA blendIndiaIndonesiaIran, Islamic Rep.IraqIrelandIsle of ManIsraelItalyJamaicaJapanJordanKazakhstanKenyaKiribatiKorea, Rep.KosovoKuwaitKyrgyz RepublicLao PDRLate-demographic dividendLatin America & Caribbean Latin America & Caribbean (excluding high income)Latin America & the Caribbean (IDA & IBRD countries)LatviaLesothoLiberiaLithuaniaLow & middle incomeLower middle incomeLuxembourgMacao SAR, ChinaMacedonia, FYRMadagascarMalawiMalaysiaMaldivesMaliMaltaMarshall IslandsMauritiusMexicoMiddle East & North AfricaMiddle East & North Africa (excluding high income)Middle East & North Africa (IDA & IBRD countries)Middle incomeMoldovaMongoliaMontenegroMoroccoMozambiqueNamibiaNepalNetherlandsNew CaledoniaNew ZealandNicaraguaNigerNigeriaNorth AmericaNorthern Mariana IslandsNorwayOECD membersOmanPakistanPalauPanamaParaguayPeruPhilippinesPolandPortugalPost-demographic dividendPuerto RicoQatarRomaniaRussian FederationRwandaSamoaSan MarinoSao Tome and PrincipeSaudi ArabiaSenegalSerbiaSeychellesSierra LeoneSingaporeSlovak RepublicSloveniaSouth AfricaSouth AsiaSouth Asia (IDA & IBRD)SpainSri LankaSt. Kitts and NevisSt. LuciaSt. Vincent and the GrenadinesSudanSurinameSwedenSwitzerlandSyrian Arab RepublicTajikistanTanzaniaThailandTimor-LesteTogoTongaTrinidad and TobagoTunisiaTurkeyUgandaUkraineUnited Arab EmiratesUnited KingdomUnited StatesUpper middle incomeUruguayVanuatuVenezuela, RBVietnamWest Bank and GazaWorldYemen, Rep.ZambiaZimbabwe Zeitlinie:
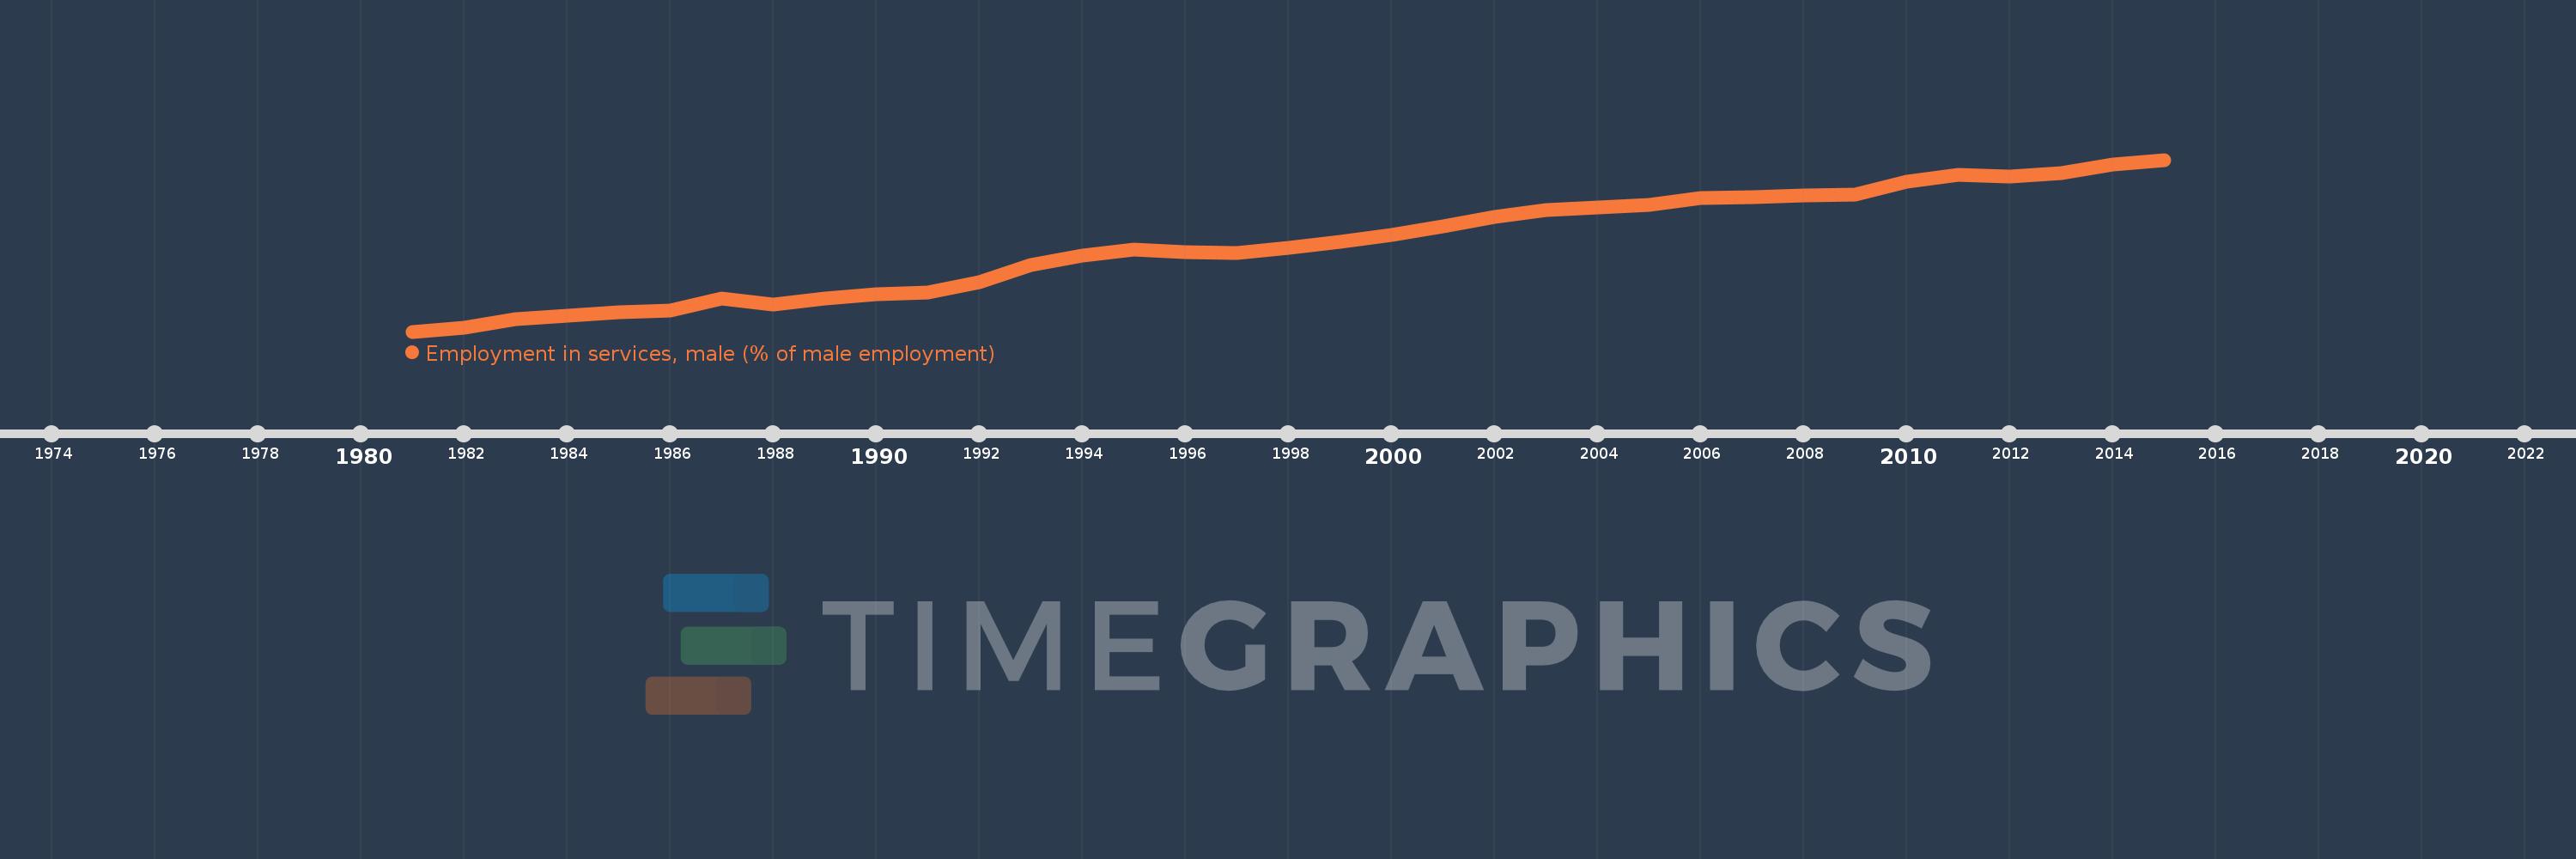
Diese Zeitleiste vorliegt die Graphik ab 1981 J. bis 2015 J. Sweden. Die Angaben bis 1980 J. sind nicht vorhanden. Die Zahl aktueller Beobachtungen nach Daten: 35.
Die Quelle (Bezeichnung):
Kennzahlen der Weltentwicklung
Die Quelle (Einrichtung):
International Labour Organization, Key Indicators of the Labour Market database.
Kategorien:
Social Protection & Labor, Gender
Es wurde aktualisiert:
23 Apr 2017 Jahr
Kennzahlen der Wertänderungen vom Jahr zum Jahr
Minimum:
47.0
1 Jan 1981 Jahr
Maximum:
67.6
1 Jan 2015 Jahr
Zum Datum der Beobachtung
Wert
Absolute Veränderung
Die Veränderung bezüglich dem vorherigen Wert
1 Jan 1981 Jahr
47.0
+47.0
0.0%
1 Jan 1982 Jahr
47.5
+0.5
1.06%
1 Jan 1983 Jahr
48.5
+1.0
2.11%
1 Jan 1984 Jahr
48.9
+0.4
0.82%
1 Jan 1985 Jahr
49.3
+0.4
0.82%
1 Jan 1986 Jahr
49.5
+0.2
0.41%
1 Jan 1987 Jahr
51.0
+1.5
3.03%
1 Jan 1988 Jahr
50.2
-0.8
-1.57%
1 Jan 1989 Jahr
51.0
+0.8
1.59%
1 Jan 1990 Jahr
51.5
+0.5
0.98%
1 Jan 1991 Jahr
51.7
+0.2
0.39%
1 Jan 1992 Jahr
52.9
+1.2
2.32%
1 Jan 1993 Jahr
55.0
+2.1
3.97%
1 Jan 1994 Jahr
56.1
+1.1
2.0%
1 Jan 1995 Jahr
56.8
+0.7
1.25%
1 Jan 1996 Jahr
56.5
-0.3
-0.53%
1 Jan 1997 Jahr
56.4
-0.1
-0.18%
1 Jan 1998 Jahr
57.0
+0.6
1.06%
1 Jan 1999 Jahr
57.8
+0.8
1.4%
1 Jan 2000 Jahr
58.6
+0.8
1.38%
1 Jan 2001 Jahr
59.6
+1.0
1.71%
1 Jan 2002 Jahr
60.8
+1.2
2.01%
1 Jan 2003 Jahr
61.6
+0.8
1.32%
1 Jan 2004 Jahr
61.9
+0.3
0.49%
1 Jan 2005 Jahr
62.2
+0.3
0.48%
1 Jan 2006 Jahr
63.0
+0.8
1.29%
1 Jan 2007 Jahr
63.1
+0.1
0.16%
1 Jan 2008 Jahr
63.3
+0.2
0.32%
1 Jan 2009 Jahr
63.4
+0.1
0.16%
1 Jan 2010 Jahr
65.0
+1.6
2.52%
1 Jan 2011 Jahr
65.8
+0.8
1.23%
1 Jan 2012 Jahr
65.6
-0.2
-0.3%
1 Jan 2013 Jahr
66.0
+0.4
0.61%
1 Jan 2014 Jahr
67.0
+1.0
1.52%
1 Jan 2015 Jahr
67.6
+0.6
0.9%
Bewertung der Länder gemäß mit laufender Statistik nach Jahren


Kommentare: