29
/de/
de
AIzaSyAYiBZKx7MnpbEhh9jyipgxe19OcubqV5w
April 1, 2024
25614
Central Europe and the Baltics
CEB
false
2
1
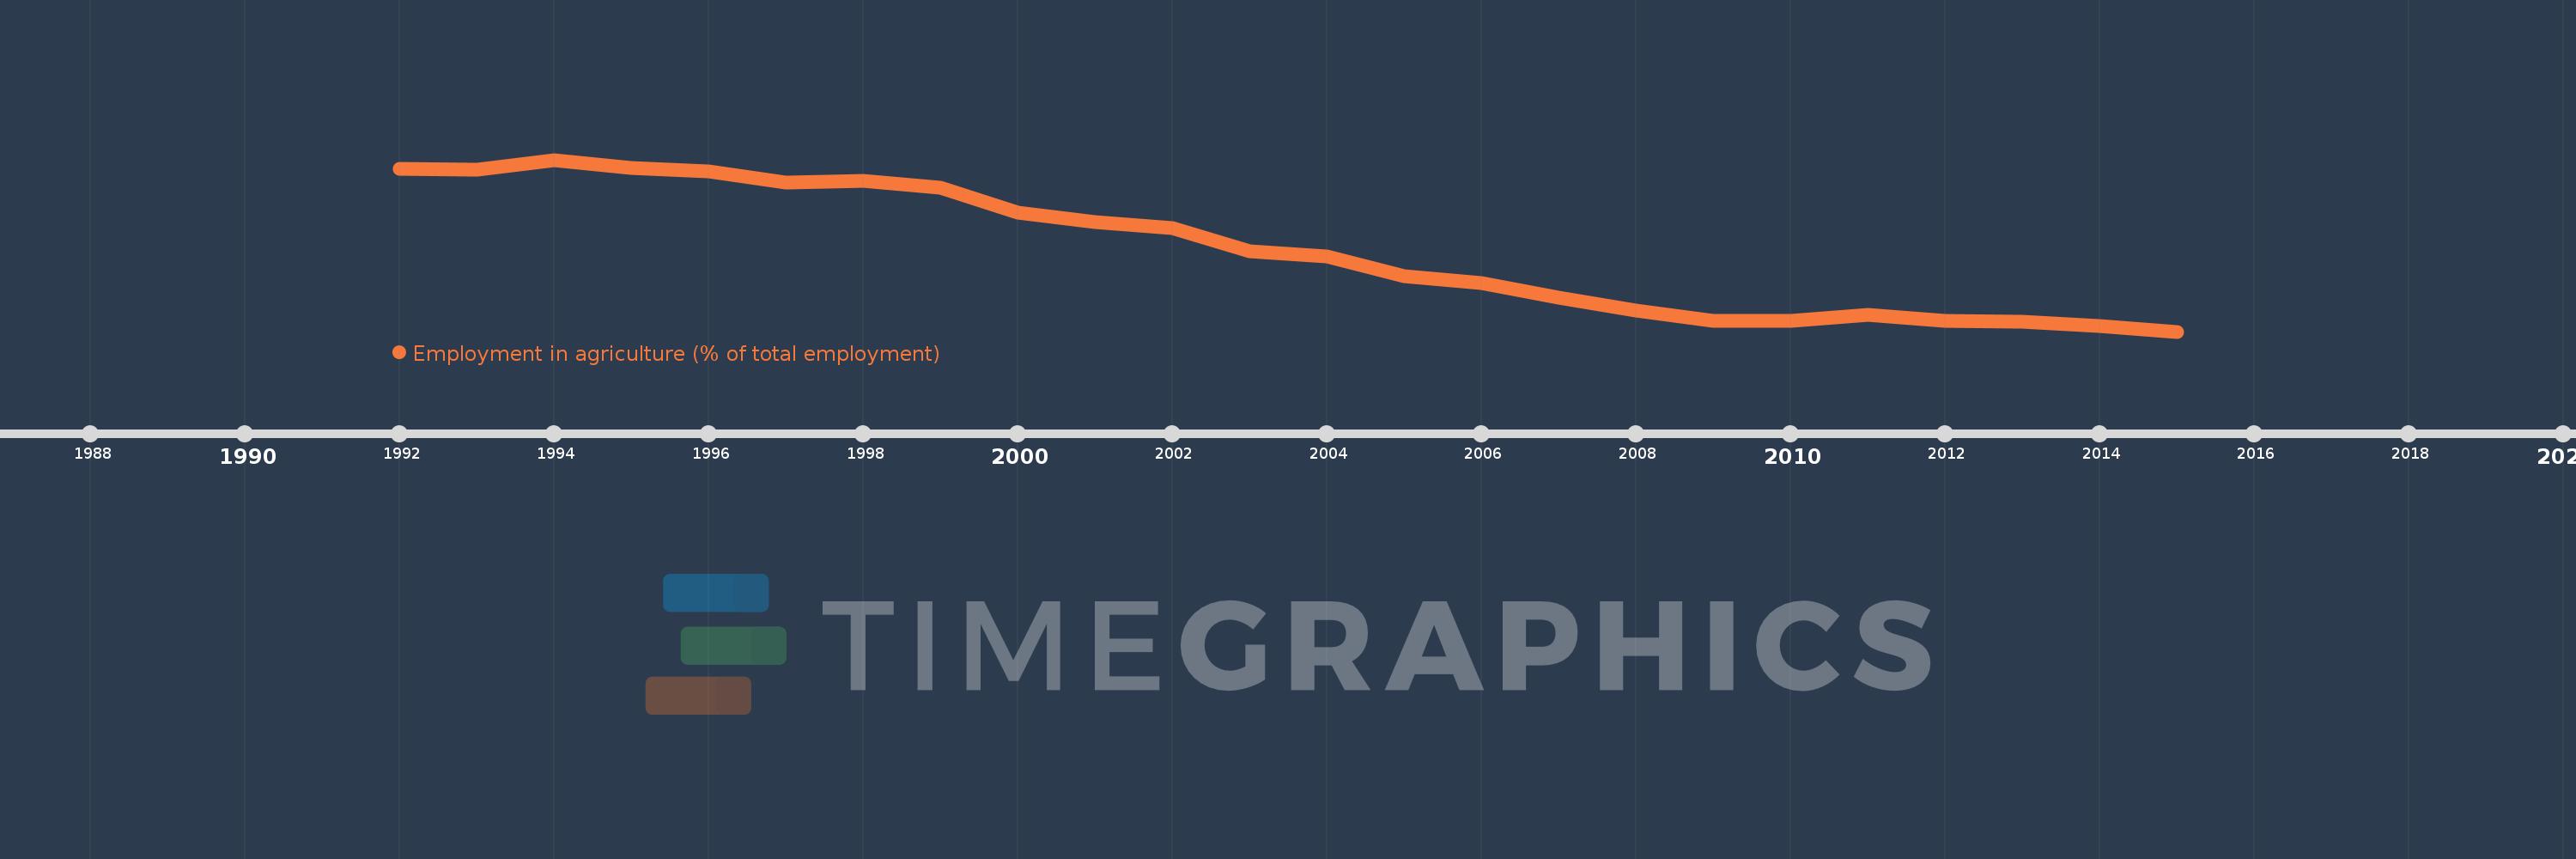
Employment in agriculture (% of total employment)
2015,2014,2013,2012,2011,2010,2009,2008,2007,2006,2005,2004,2003,2002,2001,2000,1999,1998,1997,1996,1995,1994,1993,1992
Diese Statistik in anderen Ländern:
AlbaniaAlgeriaAmerican SamoaAngolaAntigua and BarbudaArab WorldArgentinaArmeniaArubaAustraliaAustriaAzerbaijanBahamas, TheBahrainBangladeshBarbadosBelarusBelgiumBelizeBeninBermudaBhutanBoliviaBotswanaBrazilBritish Virgin IslandsBrunei DarussalamBulgariaBurkina FasoBurundiCambodiaCameroonCanadaCaribbean small statesCayman IslandsCentral Europe and the BalticsChadChileChinaColombiaCongo, Rep.Costa RicaCroatiaCubaCyprusCzech RepublicDenmarkDominicaDominican RepublicEarly-demographic dividendEast Asia & PacificEast Asia & Pacific (excluding high income)East Asia & Pacific (IDA & IBRD countries)EcuadorEgypt, Arab Rep.El SalvadorEquatorial GuineaEstoniaEthiopiaEuro areaEurope & Central AsiaEurope & Central Asia (excluding high income)Europe & Central Asia (IDA & IBRD countries)European UnionFaroe IslandsFijiFinlandFranceFrench PolynesiaGabonGambia, TheGeorgiaGermanyGhanaGreeceGreenlandGrenadaGuamGuatemalaGuineaGuyanaHaitiHigh incomeHondurasHong Kong SAR, ChinaHungaryIBRD onlyIcelandIDA & IBRD totalIDA blendIndiaIndonesiaIran, Islamic Rep.IraqIrelandIsle of ManIsraelItalyJamaicaJapanJordanKazakhstanKenyaKiribatiKorea, Rep.KosovoKuwaitKyrgyz RepublicLao PDRLate-demographic dividendLatin America & Caribbean Latin America & Caribbean (excluding high income)Latin America & the Caribbean (IDA & IBRD countries)LatviaLesothoLiberiaLibyaLithuaniaLow & middle incomeLower middle incomeLuxembourgMacao SAR, ChinaMacedonia, FYRMadagascarMalawiMalaysiaMaldivesMaliMaltaMarshall IslandsMauritiusMexicoMiddle East & North AfricaMiddle East & North Africa (excluding high income)Middle East & North Africa (IDA & IBRD countries)Middle incomeMoldovaMongoliaMontenegroMoroccoMozambiqueMyanmarNamibiaNepalNetherlandsNew CaledoniaNew ZealandNicaraguaNigerNigeriaNorth AmericaNorthern Mariana IslandsNorwayOECD membersOmanPakistanPalauPanamaPapua New GuineaParaguayPeruPhilippinesPolandPortugalPost-demographic dividendPuerto RicoQatarRomaniaRussian FederationRwandaSamoaSan MarinoSao Tome and PrincipeSaudi ArabiaSenegalSerbiaSeychellesSierra LeoneSingaporeSlovak RepublicSloveniaSouth AfricaSouth AsiaSouth Asia (IDA & IBRD)SpainSri LankaSt. Kitts and NevisSt. LuciaSt. Vincent and the GrenadinesSudanSurinameSwedenSwitzerlandSyrian Arab RepublicTajikistanTanzaniaThailandTimor-LesteTogoTongaTrinidad and TobagoTunisiaTurkeyTurks and Caicos IslandsUgandaUkraineUnited Arab EmiratesUnited KingdomUnited StatesUpper middle incomeUruguayUzbekistanVanuatuVenezuela, RBVietnamWest Bank and GazaWorldYemen, Rep.ZambiaZimbabwe Zeitlinie:
Diese Zeitleiste vorliegt die Graphik ab 1992 J. bis 2015 J. Central Europe and the Baltics. Die Angaben bis 1991 J. sind nicht vorhanden. Die Zahl aktueller Beobachtungen nach Daten: 24.
Die Quelle (Bezeichnung):
Kennzahlen der Weltentwicklung
Die Quelle (Einrichtung):
International Labour Organization, Key Indicators of the Labour Market database.
Kategorien:
Agriculture & Rural Development, Social Protection & Labor
Es wurde aktualisiert:
23 Apr 2017 Jahr
Kennzahlen der Wertänderungen vom Jahr zum Jahr
Minimum:
11.367
1 Jan 2015 Jahr
Maximum:
23.591
1 Jan 1994 Jahr
Zum Datum der Beobachtung
Wert
Absolute Veränderung
Die Veränderung bezüglich dem vorherigen Wert
1 Jan 1992 Jahr
22.968
+22.968
0.0%
1 Jan 1993 Jahr
22.91
-0.058
-0.25%
1 Jan 1994 Jahr
23.591
+0.681
2.97%
1 Jan 1995 Jahr
23.021
-0.57
-2.41%
1 Jan 1996 Jahr
22.76
-0.261
-1.14%
1 Jan 1997 Jahr
21.952
-0.807
-3.55%
1 Jan 1998 Jahr
22.098
+0.146
0.66%
1 Jan 1999 Jahr
21.596
-0.502
-2.27%
1 Jan 2000 Jahr
19.858
-1.738
-8.05%
1 Jan 2001 Jahr
19.179
-0.679
-3.42%
1 Jan 2002 Jahr
18.719
-0.46
-2.4%
1 Jan 2003 Jahr
17.069
-1.65
-8.81%
1 Jan 2004 Jahr
16.724
-0.345
-2.02%
1 Jan 2005 Jahr
15.332
-1.391
-8.32%
1 Jan 2006 Jahr
14.83
-0.502
-3.28%
1 Jan 2007 Jahr
13.775
-1.055
-7.12%
1 Jan 2008 Jahr
12.856
-0.919
-6.67%
1 Jan 2009 Jahr
12.132
-0.724
-5.63%
1 Jan 2010 Jahr
12.144
+0.012
0.1%
1 Jan 2011 Jahr
12.546
+0.402
3.31%
1 Jan 2012 Jahr
12.108
-0.439
-3.5%
1 Jan 2013 Jahr
12.094
-0.014
-0.12%
1 Jan 2014 Jahr
11.748
-0.345
-2.86%
1 Jan 2015 Jahr
11.367
-0.381
-3.24%
Bewertung der Länder gemäß mit laufender Statistik nach Jahren


Kommentare: