29
/de/
de
AIzaSyAYiBZKx7MnpbEhh9jyipgxe19OcubqV5w
April 1, 2024
249918
St. Kitts and Nevis
KNA
true
2
1
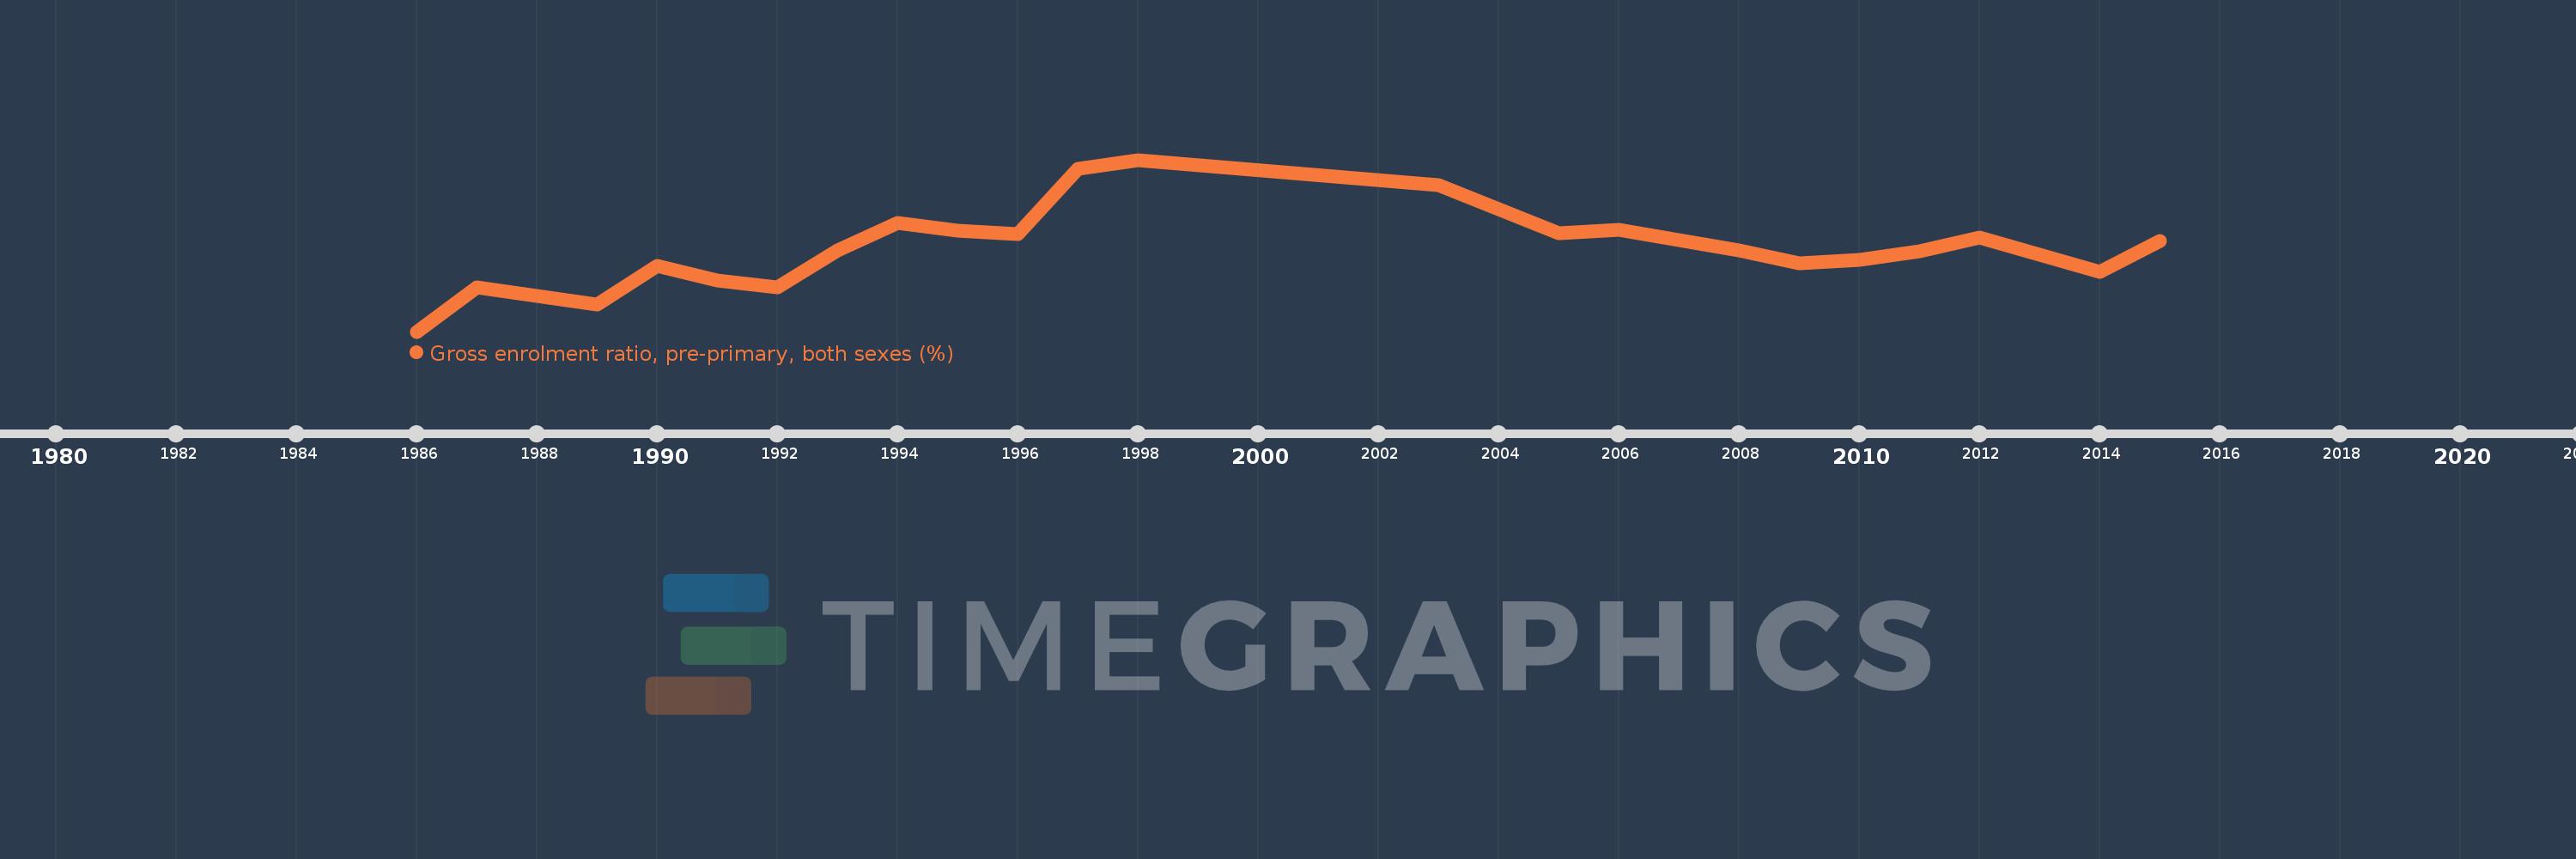
Gross enrolment ratio, pre-primary, both sexes (%)
2015,2014,2012,2011,2010,2009,2008,2006,2005,2003,1998,1997,1996,1995,1994,1993,1992,1991,1990,1989,1987,1986
Diese Statistik in anderen Ländern:
AfghanistanAlbaniaAlgeriaAndorraAngolaAntigua and BarbudaArab WorldArgentinaArmeniaArubaAustraliaAustriaAzerbaijanBahamas, TheBahrainBangladeshBarbadosBelarusBelgiumBelizeBeninBermudaBhutanBoliviaBosnia and HerzegovinaBotswanaBrazilBritish Virgin IslandsBrunei DarussalamBulgariaBurkina FasoBurundiCabo VerdeCambodiaCameroonCanadaCaribbean small statesCentral African RepublicCentral Europe and the BalticsChadChileChinaColombiaComorosCongo, Dem. Rep.Congo, Rep.Costa RicaCote d'IvoireCroatiaCubaCyprusCzech RepublicDenmarkDjiboutiDominicaDominican RepublicEarly-demographic dividendEast Asia & PacificEast Asia & Pacific (excluding high income)East Asia & Pacific (IDA & IBRD countries)EcuadorEgypt, Arab Rep.El SalvadorEquatorial GuineaEritreaEstoniaEthiopiaEuro areaEurope & Central AsiaEurope & Central Asia (excluding high income)Europe & Central Asia (IDA & IBRD countries)European UnionFijiFinlandFragile and conflict affected situationsFranceGabonGambia, TheGeorgiaGermanyGhanaGreeceGrenadaGuatemalaGuineaGuinea-BissauGuyanaHaitiHeavily indebted poor countries (HIPC)High incomeHondurasHong Kong SAR, ChinaHungaryIBRD onlyIcelandIDA & IBRD totalIDA blendIDA onlyIDA totalIndiaIndonesiaIran, Islamic Rep.IraqIrelandIsraelItalyJamaicaJapanJordanKazakhstanKenyaKiribatiKorea, Dem. People’s Rep.Korea, Rep.KuwaitKyrgyz RepublicLao PDRLate-demographic dividendLatin America & Caribbean Latin America & Caribbean (excluding high income)Latin America & the Caribbean (IDA & IBRD countries)LatviaLeast developed countries: UN classificationLebanonLesothoLiberiaLibyaLiechtensteinLithuaniaLow & middle incomeLow incomeLower middle incomeLuxembourgMacao SAR, ChinaMacedonia, FYRMadagascarMalaysiaMaldivesMaliMaltaMarshall IslandsMauritaniaMauritiusMexicoMicronesia, Fed. Sts.Middle East & North AfricaMiddle East & North Africa (excluding high income)Middle East & North Africa (IDA & IBRD countries)Middle incomeMoldovaMongoliaMontenegroMoroccoMozambiqueMyanmarNamibiaNauruNepalNetherlandsNew ZealandNicaraguaNigerNigeriaNorth AmericaNorwayOECD membersOmanOther small statesPacific island small statesPakistanPalauPanamaPapua New GuineaParaguayPeruPhilippinesPolandPortugalPost-demographic dividendPre-demographic dividendPuerto RicoQatarRomaniaRussian FederationRwandaSamoaSan MarinoSao Tome and PrincipeSaudi ArabiaSenegalSerbiaSeychellesSierra LeoneSlovak RepublicSloveniaSmall statesSolomon IslandsSomaliaSouth AfricaSouth AsiaSouth Asia (IDA & IBRD)South SudanSpainSri LankaSt. Kitts and NevisSt. LuciaSt. Vincent and the GrenadinesSub-Saharan Africa Sub-Saharan Africa (excluding high income)Sub-Saharan Africa (IDA & IBRD countries)SudanSurinameSwazilandSwedenSwitzerlandSyrian Arab RepublicTajikistanTanzaniaThailandTimor-LesteTogoTongaTrinidad and TobagoTunisiaTurkeyTurkmenistanTuvaluUgandaUkraineUnited Arab EmiratesUnited KingdomUnited StatesUpper middle incomeUruguayUzbekistanVanuatuVenezuela, RBVietnamWest Bank and GazaWorldYemen, Rep.ZambiaZimbabwe Zeitlinie:
Diese Zeitleiste vorliegt die Graphik ab 1986 J. bis 2015 J. St. Kitts and Nevis. Die Angaben bis 1985 J. sind nicht vorhanden. Die Zahl aktueller Beobachtungen nach Daten: 22.
Die Quelle (Bezeichnung):
Kennzahlen der Weltentwicklung
Die Quelle (Einrichtung):
UNESCO Institute for Statistics
Kategorien:
Education
Es wurde aktualisiert:
23 Apr 2017 Jahr
Kennzahlen der Wertänderungen vom Jahr zum Jahr
Minimum:
56.811
1 Jan 1986 Jahr
Maximum:
127.851
1 Jan 1998 Jahr
Zum Datum der Beobachtung
Wert
Absolute Veränderung
Die Veränderung bezüglich dem vorherigen Wert
1 Jan 1986 Jahr
56.811
+56.811
0.0%
1 Jan 1987 Jahr
74.938
+18.126
31.91%
1 Jan 1989 Jahr
67.986
-6.952
-9.28%
1 Jan 1990 Jahr
84.008
+16.023
23.57%
1 Jan 1991 Jahr
78.005
-6.003
-7.15%
1 Jan 1992 Jahr
75.237
-2.768
-3.55%
1 Jan 1993 Jahr
90.219
+14.982
19.91%
1 Jan 1994 Jahr
101.887
+11.668
12.93%
1 Jan 1995 Jahr
98.705
-3.181
-3.12%
1 Jan 1996 Jahr
97.185
-1.52
-1.54%
1 Jan 1997 Jahr
124.211
+27.025
27.81%
1 Jan 1998 Jahr
127.851
+3.641
2.93%
1 Jan 2003 Jahr
117.268
-10.583
-8.28%
1 Jan 2005 Jahr
97.449
-19.819
-16.9%
1 Jan 2006 Jahr
98.728
+1.279
1.31%
1 Jan 2008 Jahr
90.496
-8.233
-8.34%
1 Jan 2009 Jahr
84.945
-5.551
-6.13%
1 Jan 2010 Jahr
86.616
+1.672
1.97%
1 Jan 2011 Jahr
90.011
+3.394
3.92%
1 Jan 2012 Jahr
95.634
+5.623
6.25%
1 Jan 2014 Jahr
81.647
-13.987
-14.63%
1 Jan 2015 Jahr
94.164
+12.517
15.33%
Bewertung der Länder gemäß mit laufender Statistik nach Jahren


Kommentare: