29
/de/
de
AIzaSyAYiBZKx7MnpbEhh9jyipgxe19OcubqV5w
April 1, 2024
24648
Caribbean small states
CSS
false
2
1
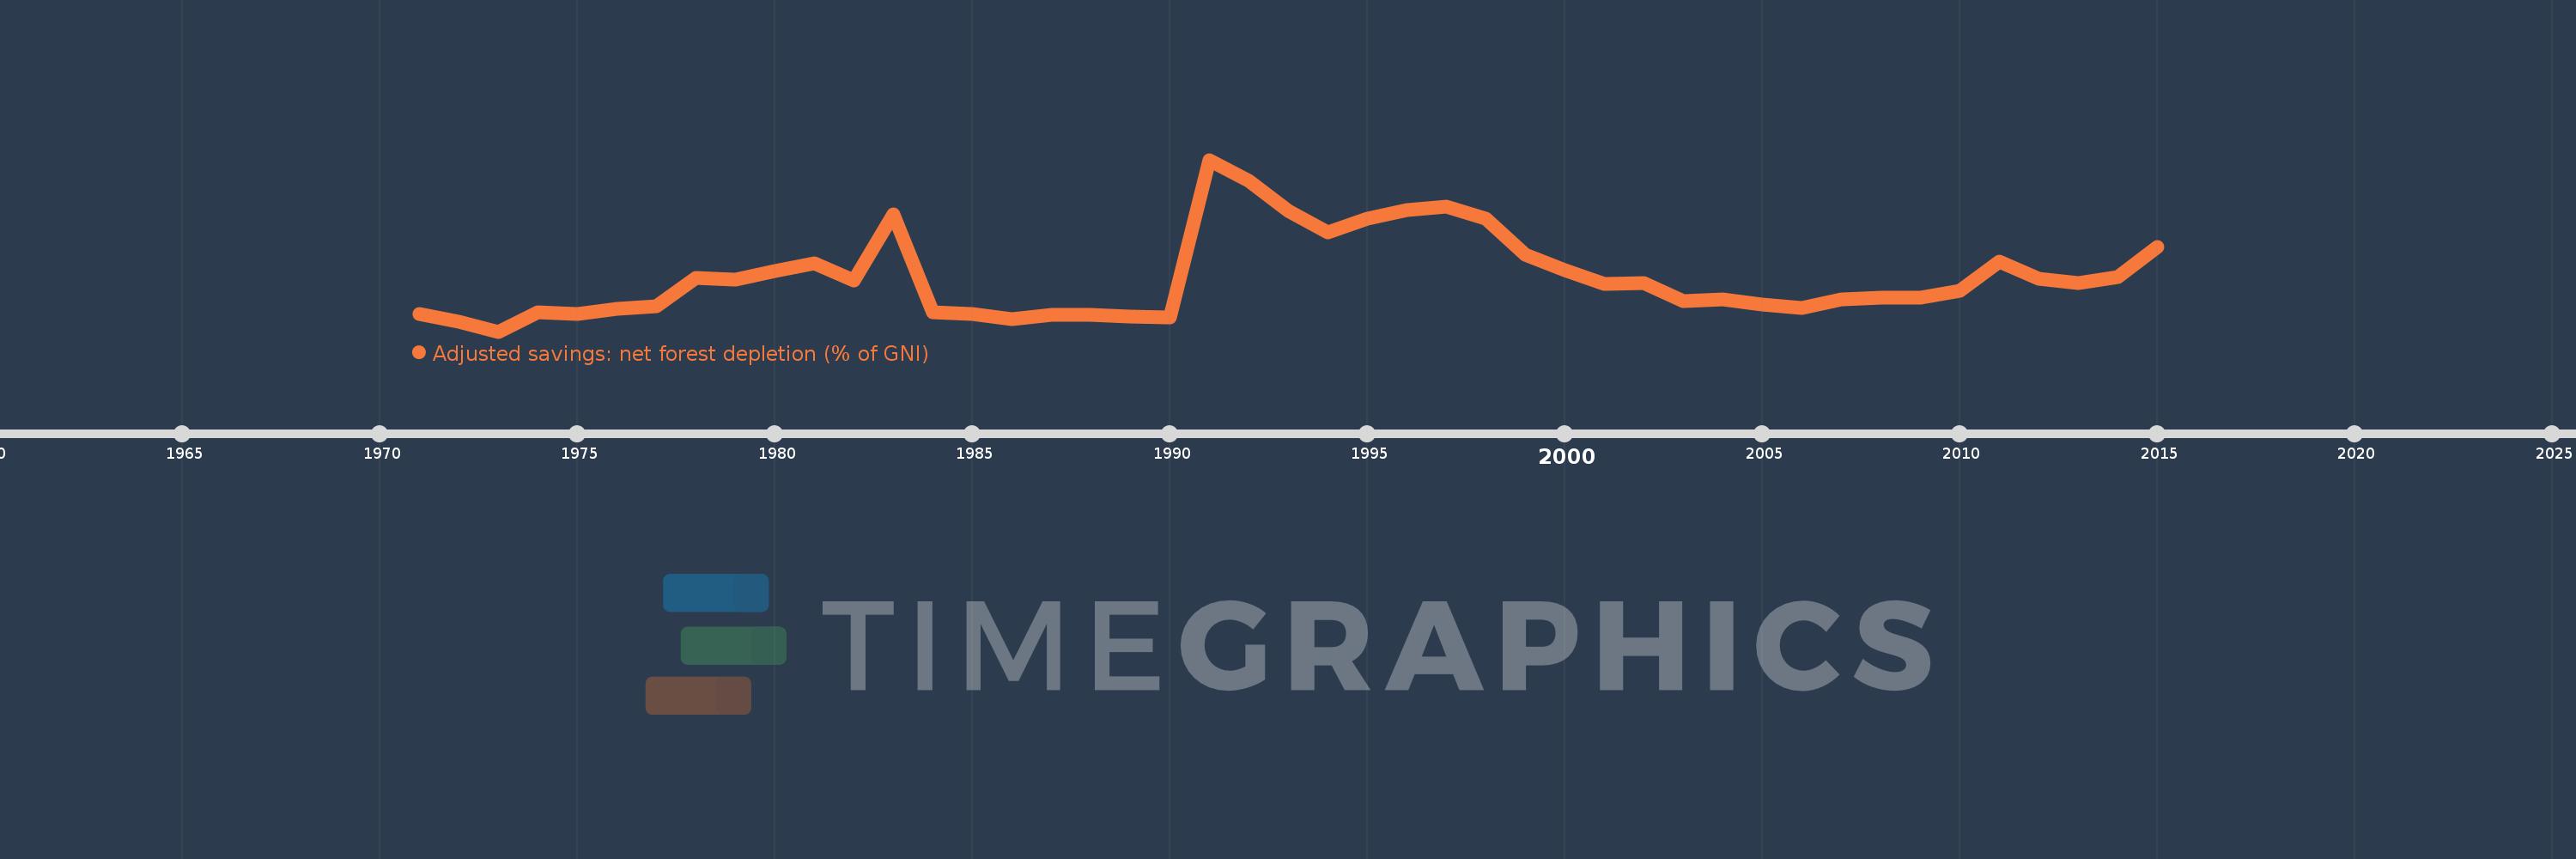
Adjusted savings: net forest depletion (% of GNI)
2015,2014,2013,2012,2011,2010,2009,2008,2007,2006,2005,2004,2003,2002,2001,2000,1999,1998,1997,1996,1995,1994,1993,1992,1991,1990,1989,1988,1987,1986,1985,1984,1983,1982,1981,1980,1979,1978,1977,1976,1975,1974,1973,1972,1971
Diese Statistik in anderen Ländern:
AfghanistanAlbaniaAlgeriaAngolaArab WorldArgentinaArmeniaAustraliaAustriaAzerbaijanBahamas, TheBahrainBangladeshBarbadosBelarusBelgiumBelizeBeninBhutanBoliviaBotswanaBrazilBrunei DarussalamBulgariaBurkina FasoBurundiCabo VerdeCambodiaCameroonCanadaCaribbean small statesCentral African RepublicCentral Europe and the BalticsChadChileChinaColombiaComorosCongo, Dem. Rep.Congo, Rep.Costa RicaCote d'IvoireCroatiaCubaCyprusCzech RepublicDenmarkDjiboutiDominicaDominican RepublicEarly-demographic dividendEast Asia & PacificEast Asia & Pacific (excluding high income)East Asia & Pacific (IDA & IBRD countries)EcuadorEgypt, Arab Rep.El SalvadorEquatorial GuineaEritreaEstoniaEthiopiaEuro areaEurope & Central AsiaEurope & Central Asia (excluding high income)Europe & Central Asia (IDA & IBRD countries)European UnionFijiFinlandFragile and conflict affected situationsFranceFrench PolynesiaGabonGambia, TheGeorgiaGermanyGhanaGreeceGuatemalaGuineaGuinea-BissauGuyanaHaitiHeavily indebted poor countries (HIPC)High incomeHondurasHong Kong SAR, ChinaHungaryIBRD onlyIcelandIDA & IBRD totalIDA blendIDA onlyIDA totalIndiaIndonesiaIran, Islamic Rep.IraqIrelandIsraelItalyJamaicaJapanJordanKazakhstanKenyaKiribatiKorea, Rep.KuwaitKyrgyz RepublicLao PDRLate-demographic dividendLatin America & Caribbean Latin America & Caribbean (excluding high income)Latin America & the Caribbean (IDA & IBRD countries)LatviaLeast developed countries: UN classificationLebanonLesothoLiberiaLibyaLithuaniaLow & middle incomeLow incomeLower middle incomeLuxembourgMacedonia, FYRMadagascarMalawiMalaysiaMaldivesMaliMauritaniaMauritiusMexicoMicronesia, Fed. Sts.Middle East & North AfricaMiddle East & North Africa (excluding high income)Middle East & North Africa (IDA & IBRD countries)Middle incomeMoldovaMongoliaMoroccoMozambiqueMyanmarNamibiaNepalNetherlandsNew CaledoniaNew ZealandNicaraguaNigerNigeriaNorth AmericaNorwayOECD membersOmanOther small statesPacific island small statesPakistanPanamaPapua New GuineaParaguayPeruPhilippinesPolandPortugalPost-demographic dividendPre-demographic dividendQatarRomaniaRussian FederationRwandaSamoaSao Tome and PrincipeSaudi ArabiaSenegalSeychellesSierra LeoneSingaporeSlovak RepublicSloveniaSmall statesSolomon IslandsSomaliaSouth AfricaSouth AsiaSouth Asia (IDA & IBRD)SpainSri LankaSt. LuciaSt. Vincent and the GrenadinesSub-Saharan Africa Sub-Saharan Africa (excluding high income)Sub-Saharan Africa (IDA & IBRD countries)SudanSurinameSwazilandSwedenSwitzerlandSyrian Arab RepublicTajikistanTanzaniaThailandTogoTongaTrinidad and TobagoTunisiaTurkeyTurkmenistanUgandaUkraineUnited Arab EmiratesUnited KingdomUnited StatesUpper middle incomeUruguayUzbekistanVanuatuVenezuela, RBVietnamWorldYemen, Rep.ZambiaZimbabwe Zeitlinie:
Diese Zeitleiste vorliegt die Graphik ab 1971 J. bis 2015 J. Caribbean small states. Die Angaben bis 1970 J. sind nicht vorhanden. Die Zahl aktueller Beobachtungen nach Daten: 45.
Die Quelle (Bezeichnung):
Kennzahlen der Weltentwicklung
Die Quelle (Einrichtung):
World Bank staff estimates based on sources and methods in World Bank's "The Changing Wealth of Nations: Measuring Sustainable Development in the New Millennium" (2011).
Kategorien:
Economy & Growth, Environment
Es wurde aktualisiert:
23 Apr 2017 Jahr
Kennzahlen der Wertänderungen vom Jahr zum Jahr
Minimum:
0.018
1 Jan 1973 Jahr
Maximum:
0.247
1 Jan 1991 Jahr
Zum Datum der Beobachtung
Wert
Absolute Veränderung
Die Veränderung bezüglich dem vorherigen Wert
1 Jan 1971 Jahr
0.041
+0.041
0.0%
1 Jan 1972 Jahr
0.031
-0.01
-24.23%
1 Jan 1973 Jahr
0.018
-0.013
-41.22%
1 Jan 1974 Jahr
0.044
+0.026
140.34%
1 Jan 1975 Jahr
0.042
-0.003
-6.42%
1 Jan 1976 Jahr
0.048
+0.007
16.49%
1 Jan 1977 Jahr
0.052
+0.004
8.56%
1 Jan 1978 Jahr
0.09
+0.037
71.16%
1 Jan 1979 Jahr
0.087
-0.003
-2.88%
1 Jan 1980 Jahr
0.099
+0.012
13.21%
1 Jan 1981 Jahr
0.109
+0.01
10.49%
1 Jan 1982 Jahr
0.086
-0.023
-21.4%
1 Jan 1983 Jahr
0.174
+0.088
102.7%
1 Jan 1984 Jahr
0.044
-0.13
-74.6%
1 Jan 1985 Jahr
0.041
-0.003
-7.11%
1 Jan 1986 Jahr
0.035
-0.006
-15.13%
1 Jan 1987 Jahr
0.04
+0.005
14.23%
1 Jan 1988 Jahr
0.04
+0.001
1.7%
1 Jan 1989 Jahr
0.038
-0.002
-6.01%
1 Jan 1990 Jahr
0.037
-0.001
-1.68%
1 Jan 1991 Jahr
0.247
+0.21
561.38%
1 Jan 1992 Jahr
0.219
-0.028
-11.34%
1 Jan 1993 Jahr
0.179
-0.04
-18.15%
1 Jan 1994 Jahr
0.15
-0.029
-16.2%
1 Jan 1995 Jahr
0.168
+0.018
11.93%
1 Jan 1996 Jahr
0.18
+0.012
6.91%
1 Jan 1997 Jahr
0.185
+0.005
2.73%
1 Jan 1998 Jahr
0.168
-0.016
-8.86%
1 Jan 1999 Jahr
0.121
-0.047
-27.94%
1 Jan 2000 Jahr
0.1
-0.022
-17.9%
1 Jan 2001 Jahr
0.082
-0.017
-17.39%
1 Jan 2002 Jahr
0.083
+0.001
1.37%
1 Jan 2003 Jahr
0.059
-0.024
-28.72%
1 Jan 2004 Jahr
0.061
+0.001
2.02%
1 Jan 2005 Jahr
0.054
-0.007
-11.24%
1 Jan 2006 Jahr
0.049
-0.005
-9.36%
1 Jan 2007 Jahr
0.061
+0.012
25.29%
1 Jan 2008 Jahr
0.063
+0.002
3.07%
1 Jan 2009 Jahr
0.063
+0.0
0.03%
1 Jan 2010 Jahr
0.072
+0.009
14.43%
1 Jan 2011 Jahr
0.111
+0.039
54.33%
1 Jan 2012 Jahr
0.088
-0.024
-21.12%
1 Jan 2013 Jahr
0.083
-0.004
-5.11%
1 Jan 2014 Jahr
0.091
+0.007
8.7%
1 Jan 2015 Jahr
0.131
+0.04
44.41%
Bewertung der Länder gemäß mit laufender Statistik nach Jahren


Kommentare: