29
/de/
de
AIzaSyAYiBZKx7MnpbEhh9jyipgxe19OcubqV5w
April 1, 2024
245623
South Africa
ZAF
true
2
1
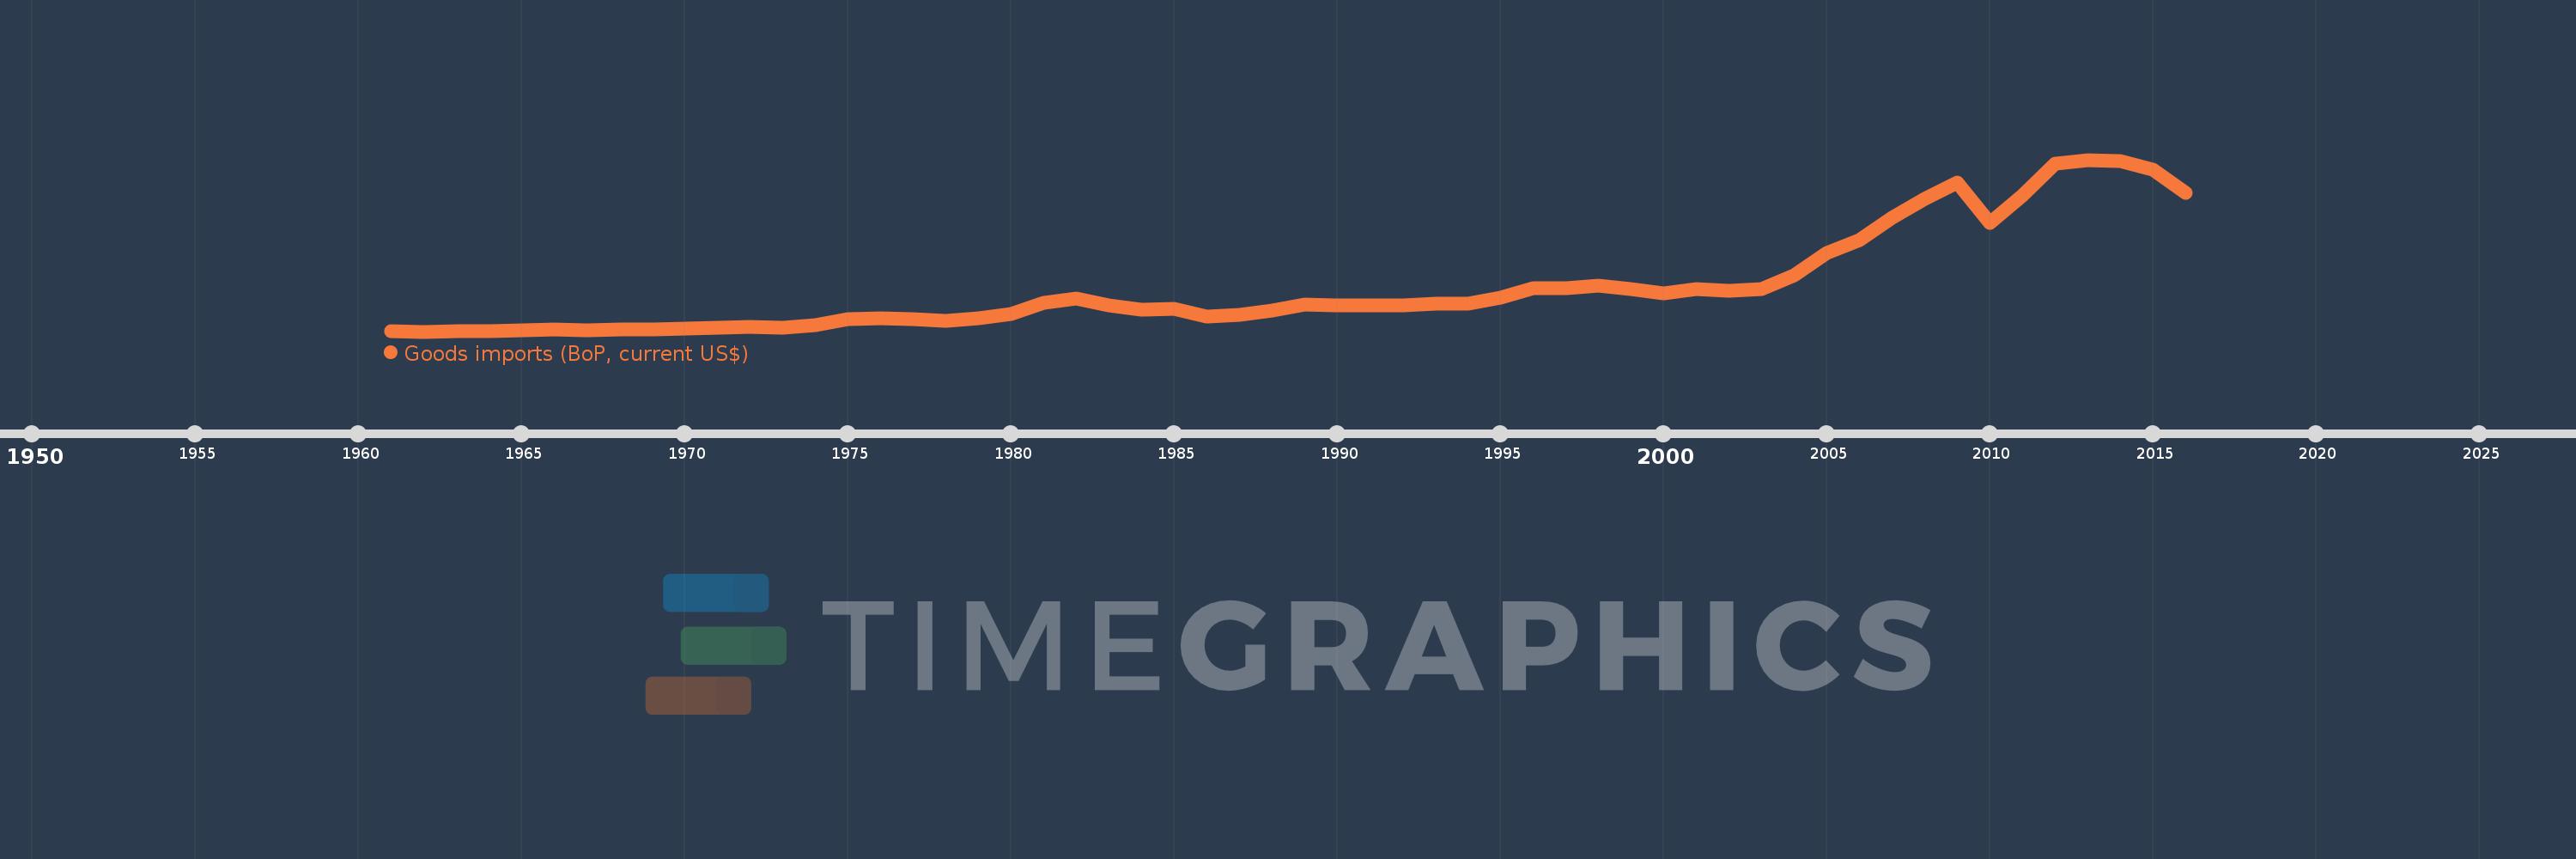
Goods imports (BoP, current US$)
2016,2015,2014,2013,2012,2011,2010,2009,2008,2007,2006,2005,2004,2003,2002,2001,2000,1999,1998,1997,1996,1995,1994,1993,1992,1991,1990,1989,1988,1987,1986,1985,1984,1983,1982,1981,1980,1979,1978,1977,1976,1975,1974,1973,1972,1971,1970,1969,1968,1967,1966,1965,1964,1963,1962,1961
Diese Statistik in anderen Ländern:
AfghanistanAlbaniaAlgeriaAngolaAntigua and BarbudaArab WorldArgentinaArmeniaArubaAustraliaAustriaAzerbaijanBahamas, TheBahrainBangladeshBarbadosBelarusBelgiumBelizeBeninBermudaBhutanBoliviaBosnia and HerzegovinaBotswanaBrazilBrunei DarussalamBulgariaBurkina FasoBurundiCabo VerdeCambodiaCameroonCanadaCaribbean small statesCentral African RepublicCentral Europe and the BalticsChadChileChinaColombiaComorosCongo, Dem. Rep.Congo, Rep.Costa RicaCote d'IvoireCroatiaCuracaoCyprusCzech RepublicDenmarkDjiboutiDominicaDominican RepublicEarly-demographic dividendEast Asia & PacificEast Asia & Pacific (excluding high income)East Asia & Pacific (IDA & IBRD countries)EcuadorEgypt, Arab Rep.El SalvadorEquatorial GuineaEritreaEstoniaEthiopiaEuro areaEurope & Central AsiaEurope & Central Asia (excluding high income)Europe & Central Asia (IDA & IBRD countries)European UnionFaroe IslandsFijiFinlandFragile and conflict affected situationsFranceFrench PolynesiaGabonGambia, TheGeorgiaGermanyGhanaGreeceGrenadaGuatemalaGuineaGuinea-BissauGuyanaHaitiHeavily indebted poor countries (HIPC)High incomeHondurasHong Kong SAR, ChinaHungaryIBRD onlyIcelandIDA & IBRD totalIDA blendIDA onlyIDA totalIndiaIndonesiaIran, Islamic Rep.IraqIrelandIsraelItalyJamaicaJapanJordanKazakhstanKenyaKiribatiKorea, Rep.KosovoKuwaitKyrgyz RepublicLao PDRLate-demographic dividendLatin America & Caribbean Latin America & Caribbean (excluding high income)Latin America & the Caribbean (IDA & IBRD countries)LatviaLeast developed countries: UN classificationLebanonLesothoLiberiaLibyaLithuaniaLow & middle incomeLow incomeLower middle incomeLuxembourgMacao SAR, ChinaMacedonia, FYRMadagascarMalawiMalaysiaMaldivesMaliMaltaMarshall IslandsMauritaniaMauritiusMexicoMicronesia, Fed. Sts.Middle East & North Africa (excluding high income)Middle East & North Africa (IDA & IBRD countries)Middle incomeMoldovaMongoliaMontenegroMoroccoMozambiqueMyanmarNamibiaNepalNetherlandsNew CaledoniaNew ZealandNicaraguaNigerNigeriaNorth AmericaNorwayOECD membersOmanOther small statesPacific island small statesPakistanPalauPanamaPapua New GuineaParaguayPeruPhilippinesPolandPortugalPost-demographic dividendPre-demographic dividendQatarRomaniaRussian FederationRwandaSamoaSao Tome and PrincipeSaudi ArabiaSenegalSerbiaSeychellesSierra LeoneSingaporeSint Maarten (Dutch part)Slovak RepublicSloveniaSmall statesSolomon IslandsSouth AfricaSouth AsiaSouth Asia (IDA & IBRD)South SudanSpainSri LankaSt. Kitts and NevisSt. LuciaSt. Vincent and the GrenadinesSub-Saharan Africa Sub-Saharan Africa (excluding high income)Sub-Saharan Africa (IDA & IBRD countries)SudanSurinameSwazilandSwedenSwitzerlandSyrian Arab RepublicTajikistanTanzaniaThailandTimor-LesteTogoTongaTrinidad and TobagoTunisiaTurkeyTuvaluUgandaUkraineUnited KingdomUnited StatesUpper middle incomeUruguayVanuatuVenezuela, RBVietnamWest Bank and GazaWorldYemen, Rep.ZambiaZimbabwe Zeitlinie:
Diese Zeitleiste vorliegt die Graphik ab 1961 J. bis 2016 J. South Africa. Die Angaben bis 1960 J. sind nicht vorhanden. Die Zahl aktueller Beobachtungen nach Daten: 56.
Die Quelle (Bezeichnung):
Kennzahlen der Weltentwicklung
Die Quelle (Einrichtung):
International Monetary Fund, Balance of Payments Statistics Yearbook and data files.
Kategorien:
Economy & Growth, Trade
Es wurde aktualisiert:
23 Apr 2017 Jahr
Kennzahlen der Wertänderungen vom Jahr zum Jahr
im Durchschnitt:
28.371 Mlrd.
Minimum:
1.457 Mlrd.
1 Jan 1962 Jahr
Maximum:
104.65 Mlrd.
1 Jan 2013 Jahr
Zum Datum der Beobachtung
Wert
Absolute Veränderung
Die Veränderung bezüglich dem vorherigen Wert
1 Jan 1961 Jahr
1.61 Mlrd.
+1.61 Mlrd.
0.0%
1 Jan 1962 Jahr
1.457 Mlrd.
-152.6 Mln.
-9.48%
1 Jan 1963 Jahr
1.488 Mlrd.
+30.8 Mln.
2.11%
1 Jan 1964 Jahr
1.844 Mlrd.
+355.6 Mln.
23.89%
1 Jan 1965 Jahr
2.265 Mlrd.
+421.4 Mln.
22.85%
1 Jan 1966 Jahr
2.579 Mlrd.
+313.6 Mln.
13.84%
1 Jan 1967 Jahr
2.379 Mlrd.
-200.2 Mln.
-7.76%
1 Jan 1968 Jahr
2.797 Mlrd.
+418.6 Mln.
17.6%
1 Jan 1969 Jahr
2.734 Mlrd.
-63.0 Mln.
-2.25%
1 Jan 1970 Jahr
3.105 Mlrd.
+371.0 Mln.
13.57%
1 Jan 1971 Jahr
3.72 Mlrd.
+614.6 Mln.
19.79%
1 Jan 1972 Jahr
4.207 Mlrd.
+487.427 Mln.
13.1%
1 Jan 1973 Jahr
3.832 Mlrd.
-375.428 Mln.
-8.92%
1 Jan 1974 Jahr
5.331 Mlrd.
+1.5 Mlrd.
39.13%
1 Jan 1975 Jahr
8.687 Mlrd.
+3.356 Mlrd.
62.94%
1 Jan 1976 Jahr
9.381 Mlrd.
+693.722 Mln.
7.99%
1 Jan 1977 Jahr
8.75 Mlrd.
-630.391 Mln.
-6.72%
1 Jan 1978 Jahr
8.135 Mlrd.
-615.25 Mln.
-7.03%
1 Jan 1979 Jahr
9.52 Mlrd.
+1.385 Mlrd.
17.02%
1 Jan 1980 Jahr
11.984 Mlrd.
+2.465 Mlrd.
25.89%
1 Jan 1981 Jahr
18.778 Mlrd.
+6.793 Mlrd.
56.68%
1 Jan 1982 Jahr
21.179 Mlrd.
+2.401 Mlrd.
12.79%
1 Jan 1983 Jahr
17.069 Mlrd.
-4.11 Mlrd.
-19.41%
1 Jan 1984 Jahr
14.53 Mlrd.
-2.538 Mlrd.
-14.87%
1 Jan 1985 Jahr
15.073 Mlrd.
+542.841 Mln.
3.74%
1 Jan 1986 Jahr
10.72 Mlrd.
-4.354 Mlrd.
-28.88%
1 Jan 1987 Jahr
11.467 Mlrd.
+747.595 Mln.
6.97%
1 Jan 1988 Jahr
14.299 Mlrd.
+2.832 Mlrd.
24.7%
1 Jan 1989 Jahr
17.539 Mlrd.
+3.24 Mlrd.
22.66%
1 Jan 1990 Jahr
17.111 Mlrd.
-427.915 Mln.
-2.44%
1 Jan 1991 Jahr
17.194 Mlrd.
+83.239 Mln.
0.49%
1 Jan 1992 Jahr
17.177 Mlrd.
-17.516 Mln.
-0.1%
1 Jan 1993 Jahr
18.235 Mlrd.
+1.058 Mlrd.
6.16%
1 Jan 1994 Jahr
18.478 Mlrd.
+242.563 Mln.
1.33%
1 Jan 1995 Jahr
21.843 Mlrd.
+3.365 Mlrd.
18.21%
1 Jan 1996 Jahr
27.393 Mlrd.
+5.55 Mlrd.
25.41%
1 Jan 1997 Jahr
27.556 Mlrd.
+163.061 Mln.
0.6%
1 Jan 1998 Jahr
28.838 Mlrd.
+1.282 Mlrd.
4.65%
1 Jan 1999 Jahr
27.196 Mlrd.
-1.642 Mlrd.
-5.69%
1 Jan 2000 Jahr
24.511 Mlrd.
-2.685 Mlrd.
-9.87%
1 Jan 2001 Jahr
27.225 Mlrd.
+2.714 Mlrd.
11.07%
1 Jan 2002 Jahr
25.799 Mlrd.
-1.426 Mlrd.
-5.24%
1 Jan 2003 Jahr
27.016 Mlrd.
+1.217 Mlrd.
4.72%
1 Jan 2004 Jahr
35.27 Mlrd.
+8.254 Mlrd.
30.55%
1 Jan 2005 Jahr
48.518 Mlrd.
+13.249 Mlrd.
37.56%
1 Jan 2006 Jahr
56.572 Mlrd.
+8.054 Mlrd.
16.6%
1 Jan 2007 Jahr
69.627 Mlrd.
+13.055 Mlrd.
23.08%
1 Jan 2008 Jahr
81.262 Mlrd.
+11.635 Mlrd.
16.71%
1 Jan 2009 Jahr
90.963 Mlrd.
+9.701 Mlrd.
11.94%
1 Jan 2010 Jahr
66.882 Mlrd.
-24.081 Mlrd.
-26.47%
1 Jan 2011 Jahr
83.362 Mlrd.
+16.48 Mlrd.
24.64%
1 Jan 2012 Jahr
102.558 Mlrd.
+19.196 Mlrd.
23.03%
1 Jan 2013 Jahr
104.65 Mlrd.
+2.092 Mlrd.
2.04%
1 Jan 2014 Jahr
103.904 Mlrd.
-745.683 Mln.
-0.71%
1 Jan 2015 Jahr
98.597 Mlrd.
-5.307 Mlrd.
-5.11%
1 Jan 2016 Jahr
84.567 Mlrd.
-14.03 Mlrd.
-14.23%
Bewertung der Länder gemäß mit laufender Statistik nach Jahren


Kommentare: