29
/de/
de
AIzaSyAYiBZKx7MnpbEhh9jyipgxe19OcubqV5w
April 1, 2024
240777
Singapore
SGP
true
2
1
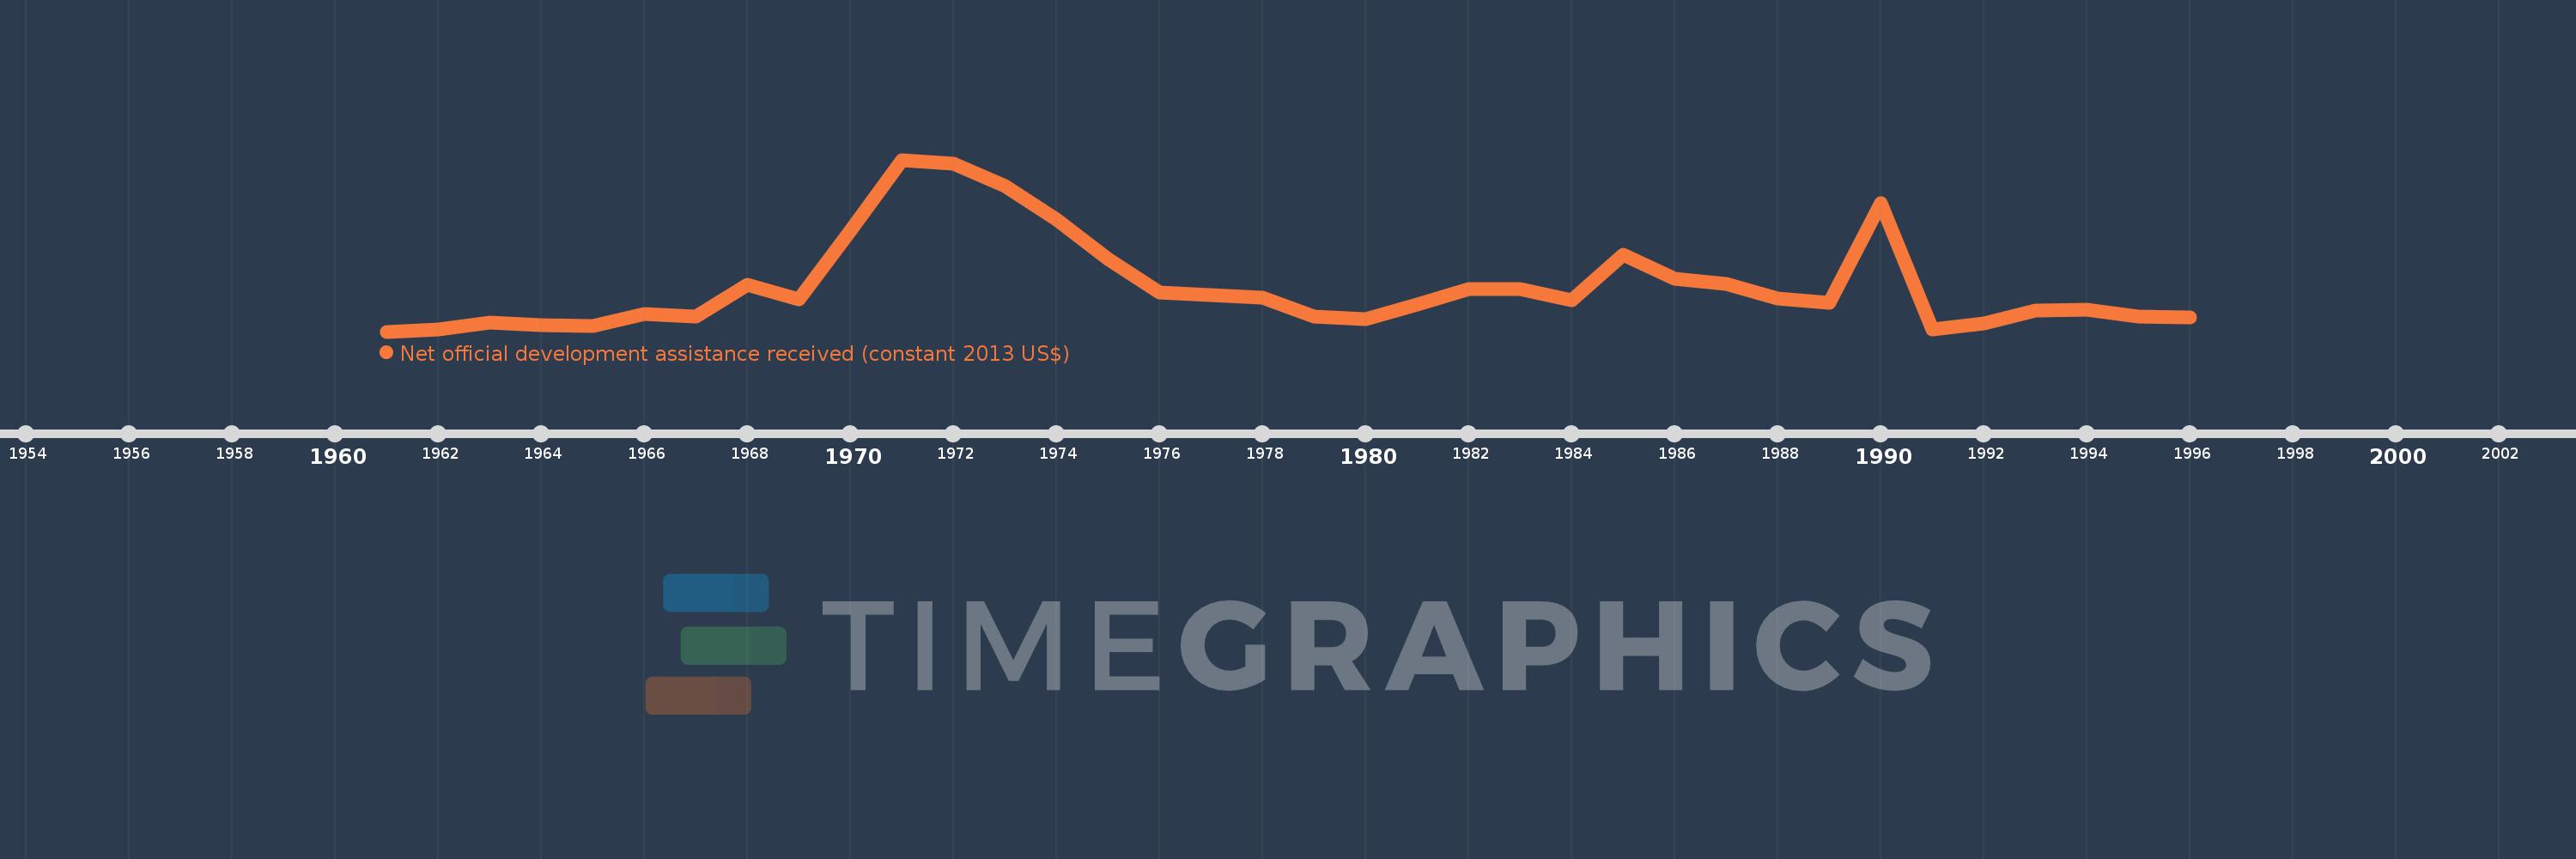
Net official development assistance received (constant 2013 US$)
1996,1995,1994,1993,1992,1991,1990,1989,1988,1987,1986,1985,1984,1983,1982,1981,1980,1979,1978,1977,1976,1975,1974,1973,1972,1971,1970,1969,1968,1967,1966,1965,1964,1963,1962,1961
Diese Statistik in anderen Ländern:
AfghanistanAlbaniaAlgeriaAngolaAntigua and BarbudaArab WorldArgentinaArmeniaArubaAzerbaijanBahamas, TheBahrainBangladeshBarbadosBelarusBelizeBeninBermudaBhutanBoliviaBosnia and HerzegovinaBotswanaBrazilBritish Virgin IslandsBrunei DarussalamBurkina FasoBurundiCabo VerdeCambodiaCameroonCaribbean small statesCayman IslandsCentral African RepublicCentral Europe and the BalticsChadChileChinaColombiaComorosCongo, Dem. Rep.Congo, Rep.Costa RicaCote d'IvoireCroatiaCubaCyprusDjiboutiDominicaDominican RepublicEast Asia & PacificEast Asia & Pacific (excluding high income)East Asia & Pacific (IDA & IBRD countries)EcuadorEgypt, Arab Rep.El SalvadorEquatorial GuineaEritreaEthiopiaEuro areaEurope & Central AsiaEurope & Central Asia (excluding high income)Europe & Central Asia (IDA & IBRD countries)European UnionFijiFragile and conflict affected situationsFrench PolynesiaGabonGambia, TheGeorgiaGhanaGibraltarGrenadaGuatemalaGuineaGuinea-BissauGuyanaHaitiHeavily indebted poor countries (HIPC)High incomeHondurasHong Kong SAR, ChinaIBRD onlyIDA & IBRD totalIDA blendIDA onlyIDA totalIndiaIndonesiaIran, Islamic Rep.IraqIsraelJamaicaJordanKazakhstanKenyaKiribatiKorea, Dem. People’s Rep.Korea, Rep.KosovoKuwaitKyrgyz RepublicLao PDRLatin America & Caribbean Latin America & Caribbean (excluding high income)Latin America & the Caribbean (IDA & IBRD countries)Least developed countries: UN classificationLebanonLesothoLiberiaLibyaLow & middle incomeLow incomeLower middle incomeMacao SAR, ChinaMacedonia, FYRMadagascarMalawiMalaysiaMaldivesMaliMaltaMarshall IslandsMauritaniaMauritiusMexicoMicronesia, Fed. Sts.Middle East & North AfricaMiddle East & North Africa (excluding high income)Middle East & North Africa (IDA & IBRD countries)Middle incomeMoldovaMongoliaMontenegroMoroccoMozambiqueMyanmarNamibiaNauruNepalNew CaledoniaNicaraguaNigerNigeriaNorth AmericaNorthern Mariana IslandsOECD membersOmanOther small statesPacific island small statesPakistanPalauPanamaPapua New GuineaParaguayPeruPhilippinesQatarRwandaSamoaSao Tome and PrincipeSaudi ArabiaSenegalSerbiaSeychellesSierra LeoneSingaporeSloveniaSmall statesSolomon IslandsSomaliaSouth AfricaSouth AsiaSouth Asia (IDA & IBRD)South SudanSri LankaSt. Kitts and NevisSt. LuciaSt. Vincent and the GrenadinesSub-Saharan Africa Sub-Saharan Africa (excluding high income)Sub-Saharan Africa (IDA & IBRD countries)SudanSurinameSwazilandSyrian Arab RepublicTajikistanTanzaniaThailandTimor-LesteTogoTongaTrinidad and TobagoTunisiaTurkeyTurkmenistanTurks and Caicos IslandsTuvaluUgandaUkraineUnited Arab EmiratesUpper middle incomeUruguayUzbekistanVanuatuVenezuela, RBVietnamWest Bank and GazaWorldYemen, Rep.ZambiaZimbabwe Zeitlinie:
Diese Zeitleiste vorliegt die Graphik ab 1961 J. bis 1996 J. Singapore. Die Angaben bis 1960 J. sind nicht vorhanden. Die Zahl aktueller Beobachtungen nach Daten: 36.
Die Quelle (Bezeichnung):
Kennzahlen der Weltentwicklung
Die Quelle (Einrichtung):
Development Assistance Committee of the Organisation for Economic Co-operation and Development, Geographical Distribution of Financial Flows to Developing Countries, Development Co-operation Report, and International Development Statistics database. Data are available online at: www.oecd.org/dac/stats/idsonline.
Kategorien:
Aid Effectiveness
Es wurde aktualisiert:
23 Apr 2017 Jahr
Kennzahlen der Wertänderungen vom Jahr zum Jahr
im Durchschnitt:
57.371 Mln.
Minimum:
-2.72 Mln.
1 Jan 1961 Jahr
Maximum:
224.49 Mln.
1 Jan 1971 Jahr
Zum Datum der Beobachtung
Wert
Absolute Veränderung
Die Veränderung bezüglich dem vorherigen Wert
1 Jan 1961 Jahr
-2.72 Mln.
-2.72 Mln.
0.0%
1 Jan 1962 Jahr
-390.0 Tsnd.
+2.33 Mln.
-85.66%
1 Jan 1963 Jahr
9.33 Mln.
+9.72 Mln.
-2.49 Tsnd.%
1 Jan 1964 Jahr
5.44 Mln.
-3.89 Mln.
-41.69%
1 Jan 1965 Jahr
4.48 Mln.
-960.0 Tsnd.
-17.65%
1 Jan 1966 Jahr
21.1 Mln.
+16.62 Mln.
370.98%
1 Jan 1967 Jahr
16.64 Mln.
-4.46 Mln.
-21.14%
1 Jan 1968 Jahr
58.8 Mln.
+42.16 Mln.
253.37%
1 Jan 1969 Jahr
40.18 Mln.
-18.62 Mln.
-31.67%
1 Jan 1970 Jahr
131.25 Mln.
+91.07 Mln.
226.66%
1 Jan 1971 Jahr
224.49 Mln.
+93.24 Mln.
71.04%
1 Jan 1972 Jahr
219.7 Mln.
-4.79 Mln.
-2.13%
1 Jan 1973 Jahr
189.71 Mln.
-29.99 Mln.
-13.65%
1 Jan 1974 Jahr
146.06 Mln.
-43.65 Mln.
-23.01%
1 Jan 1975 Jahr
93.23 Mln.
-52.83 Mln.
-36.17%
1 Jan 1976 Jahr
49.08 Mln.
-44.15 Mln.
-47.36%
1 Jan 1977 Jahr
45.67 Mln.
-3.41 Mln.
-6.95%
1 Jan 1978 Jahr
41.99 Mln.
-3.68 Mln.
-8.06%
1 Jan 1979 Jahr
16.68 Mln.
-25.31 Mln.
-60.28%
1 Jan 1980 Jahr
13.36 Mln.
-3.32 Mln.
-19.9%
1 Jan 1981 Jahr
33.38 Mln.
+20.02 Mln.
149.85%
1 Jan 1982 Jahr
53.18 Mln.
+19.8 Mln.
59.32%
1 Jan 1983 Jahr
53.91 Mln.
+730.0 Tsnd.
1.37%
1 Jan 1984 Jahr
38.47 Mln.
-15.44 Mln.
-28.64%
1 Jan 1985 Jahr
98.87 Mln.
+60.4 Mln.
157.01%
1 Jan 1986 Jahr
66.94 Mln.
-31.93 Mln.
-32.29%
1 Jan 1987 Jahr
60.61 Mln.
-6.33 Mln.
-9.46%
1 Jan 1988 Jahr
41.32 Mln.
-19.29 Mln.
-31.83%
1 Jan 1989 Jahr
34.88 Mln.
-6.44 Mln.
-15.59%
1 Jan 1990 Jahr
167.0 Mln.
+132.12 Mln.
378.78%
1 Jan 1991 Jahr
340.0 Tsnd.
-166.66 Mln.
-99.8%
1 Jan 1992 Jahr
8.17 Mln.
+7.83 Mln.
2.3 Tsnd.%
1 Jan 1993 Jahr
24.76 Mln.
+16.59 Mln.
203.06%
1 Jan 1994 Jahr
26.35 Mln.
+1.59 Mln.
6.42%
1 Jan 1995 Jahr
17.47 Mln.
-8.88 Mln.
-33.7%
1 Jan 1996 Jahr
15.61 Mln.
-1.86 Mln.
-10.65%
Bewertung der Länder gemäß mit laufender Statistik nach Jahren


Kommentare: