29
/de/
de
AIzaSyAYiBZKx7MnpbEhh9jyipgxe19OcubqV5w
April 1, 2024
231330
Rwanda
RWA
true
2
1
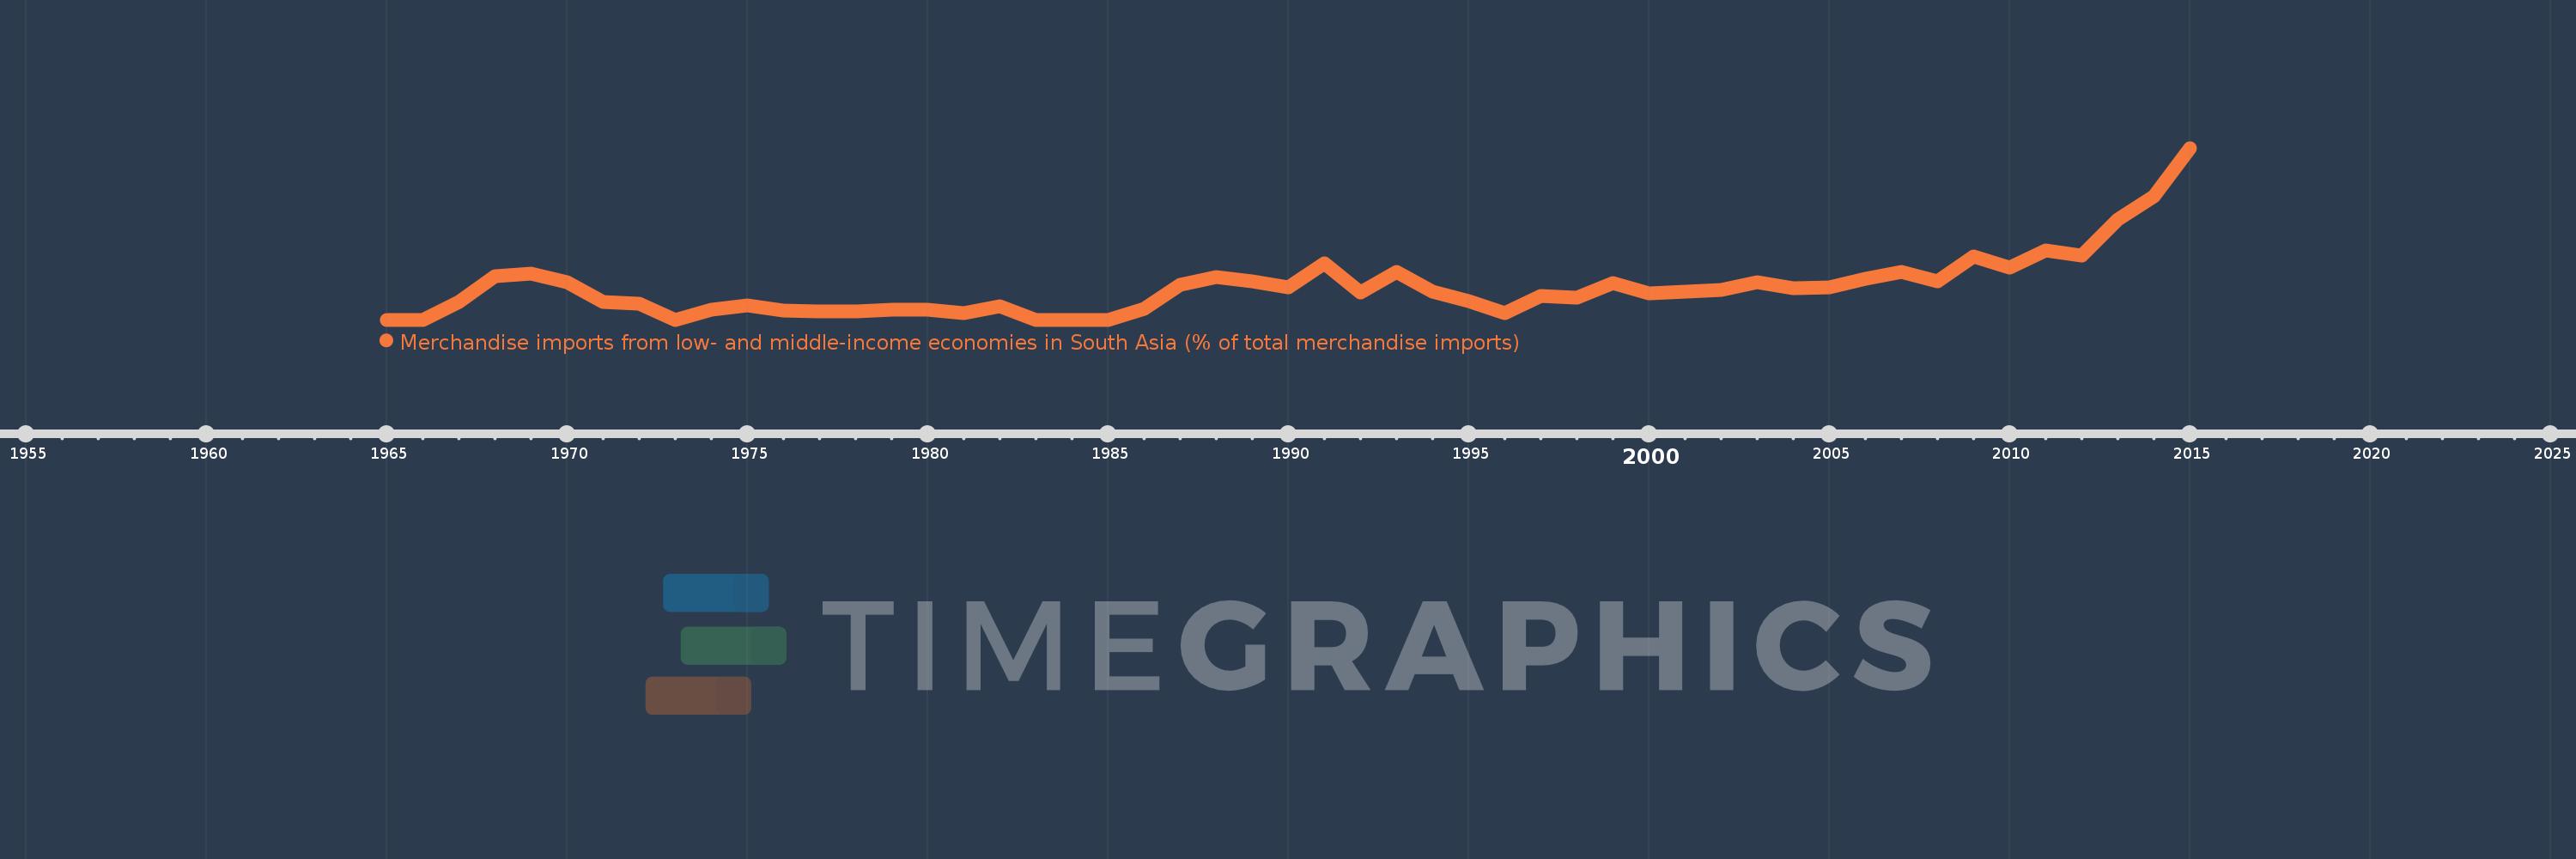
Merchandise imports from low- and middle-income economies in South Asia (% of total merchandise imports)
2015,2014,2013,2012,2011,2010,2009,2008,2007,2006,2005,2004,2003,2002,2001,2000,1999,1998,1997,1996,1995,1994,1993,1992,1991,1990,1989,1988,1987,1986,1985,1984,1983,1982,1981,1980,1979,1978,1977,1976,1975,1974,1973,1972,1971,1970,1969,1968,1967,1966,1965
Diese Statistik in anderen Ländern:
AfghanistanAlbaniaAlgeriaAngolaAntigua and BarbudaArab WorldArgentinaArmeniaArubaAustraliaAustriaAzerbaijanBahamas, TheBahrainBangladeshBarbadosBelarusBelgiumBelizeBeninBermudaBoliviaBrazilBrunei DarussalamBulgariaBurkina FasoBurundiCabo VerdeCambodiaCameroonCanadaCaribbean small statesCentral African RepublicCentral Europe and the BalticsChadChileChinaColombiaCongo, Dem. Rep.Congo, Rep.Costa RicaCote d'IvoireCroatiaCubaCyprusCzech RepublicDenmarkDjiboutiDominicaDominican RepublicEarly-demographic dividendEast Asia & PacificEast Asia & Pacific (excluding high income)East Asia & Pacific (IDA & IBRD countries)EcuadorEgypt, Arab Rep.El SalvadorEstoniaEthiopiaEuro areaEurope & Central AsiaEurope & Central Asia (excluding high income)Europe & Central Asia (IDA & IBRD countries)European UnionFaroe IslandsFijiFinlandFragile and conflict affected situationsFranceGabonGambia, TheGeorgiaGermanyGhanaGibraltarGreeceGreenlandGrenadaGuatemalaGuineaGuyanaHaitiHeavily indebted poor countries (HIPC)High incomeHondurasHong Kong SAR, ChinaHungaryIBRD onlyIcelandIDA & IBRD totalIDA blendIDA onlyIDA totalIndiaIndonesiaIran, Islamic Rep.IraqIrelandIsraelItalyJamaicaJapanJordanKazakhstanKenyaKiribatiKorea, Dem. People’s Rep.Korea, Rep.KosovoKuwaitKyrgyz RepublicLao PDRLate-demographic dividendLatin America & Caribbean Latin America & Caribbean (excluding high income)Latin America & the Caribbean (IDA & IBRD countries)LatviaLeast developed countries: UN classificationLebanonLiberiaLibyaLithuaniaLow & middle incomeLow incomeLower middle incomeLuxembourgMacao SAR, ChinaMacedonia, FYRMadagascarMalawiMalaysiaMaldivesMaliMaltaMauritaniaMauritiusMexicoMiddle East & North AfricaMiddle East & North Africa (excluding high income)Middle East & North Africa (IDA & IBRD countries)Middle incomeMoldovaMongoliaMontenegroMoroccoMozambiqueMyanmarNauruNepalNetherlandsNew CaledoniaNew ZealandNicaraguaNigerNigeriaNorth AmericaNorwayOECD membersOmanOther small statesPacific island small statesPakistanPanamaPapua New GuineaParaguayPeruPhilippinesPolandPortugalPost-demographic dividendPre-demographic dividendQatarRomaniaRussian FederationRwandaSamoaSaudi ArabiaSenegalSerbiaSeychellesSierra LeoneSingaporeSlovak RepublicSloveniaSmall statesSolomon IslandsSomaliaSouth AfricaSouth AsiaSouth Asia (IDA & IBRD)SpainSri LankaSt. Kitts and NevisSt. LuciaSt. Vincent and the GrenadinesSub-Saharan Africa Sub-Saharan Africa (excluding high income)Sub-Saharan Africa (IDA & IBRD countries)SudanSurinameSwedenSwitzerlandSyrian Arab RepublicTajikistanTanzaniaThailandTogoTongaTrinidad and TobagoTunisiaTurkeyTurkmenistanUgandaUkraineUnited Arab EmiratesUnited KingdomUnited StatesUpper middle incomeUruguayUzbekistanVanuatuVenezuela, RBVietnamWorldYemen, Rep.ZambiaZimbabwe Zeitlinie:
Diese Zeitleiste vorliegt die Graphik ab 1965 J. bis 2015 J. Rwanda. Die Angaben bis 1964 J. sind nicht vorhanden. Die Zahl aktueller Beobachtungen nach Daten: 51.
Die Quelle (Bezeichnung):
Kennzahlen der Weltentwicklung
Die Quelle (Einrichtung):
World Bank staff estimates based data from International Monetary Fund's Direction of Trade database.
Kategorien:
Private Sector, Trade
Es wurde aktualisiert:
23 Apr 2017 Jahr
Kennzahlen der Wertänderungen vom Jahr zum Jahr
Minimum:
0.0
1 Jan 1965 Jahr
Maximum:
9.8
1 Jan 2015 Jahr
Zum Datum der Beobachtung
Wert
Absolute Veränderung
Die Veränderung bezüglich dem vorherigen Wert
1 Jan 1965 Jahr
0.0
0.0
0.0%
1 Jan 1967 Jahr
1.0
+1.0
%
1 Jan 1968 Jahr
2.475
+1.475
147.52%
1 Jan 1969 Jahr
2.643
+0.168
6.78%
1 Jan 1970 Jahr
2.137
-0.506
-19.16%
1 Jan 1971 Jahr
1.038
-1.099
-51.42%
1 Jan 1972 Jahr
0.917
-0.121
-11.62%
1 Jan 1973 Jahr
0.0
-0.917
-100.0%
1 Jan 1974 Jahr
0.568
+0.568
%
1 Jan 1975 Jahr
0.811
+0.243
42.81%
1 Jan 1976 Jahr
0.521
-0.289
-35.69%
1 Jan 1977 Jahr
0.486
-0.036
-6.87%
1 Jan 1978 Jahr
0.457
-0.029
-5.87%
1 Jan 1979 Jahr
0.584
+0.127
27.76%
1 Jan 1980 Jahr
0.565
-0.019
-3.24%
1 Jan 1981 Jahr
0.39
-0.175
-31.04%
1 Jan 1982 Jahr
0.755
+0.365
93.73%
1 Jan 1983 Jahr
0.0
-0.755
-100.0%
1 Jan 1986 Jahr
0.616
+0.616
%
1 Jan 1987 Jahr
1.996
+1.379
223.72%
1 Jan 1988 Jahr
2.432
+0.436
21.85%
1 Jan 1989 Jahr
2.189
-0.243
-9.98%
1 Jan 1990 Jahr
1.827
-0.362
-16.53%
1 Jan 1991 Jahr
3.205
+1.377
75.37%
1 Jan 1992 Jahr
1.557
-1.647
-51.4%
1 Jan 1993 Jahr
2.709
+1.151
73.92%
1 Jan 1994 Jahr
1.615
-1.094
-40.39%
1 Jan 1995 Jahr
1.081
-0.534
-33.08%
1 Jan 1996 Jahr
0.374
-0.707
-65.41%
1 Jan 1997 Jahr
1.366
+0.992
265.45%
1 Jan 1998 Jahr
1.235
-0.131
-9.61%
1 Jan 1999 Jahr
2.097
+0.862
69.85%
1 Jan 2000 Jahr
1.521
-0.576
-27.47%
1 Jan 2001 Jahr
1.591
+0.07
4.59%
1 Jan 2002 Jahr
1.707
+0.116
7.27%
1 Jan 2003 Jahr
2.15
+0.444
25.99%
1 Jan 2004 Jahr
1.793
-0.357
-16.59%
1 Jan 2005 Jahr
1.857
+0.064
3.57%
1 Jan 2006 Jahr
2.322
+0.465
25.02%
1 Jan 2007 Jahr
2.718
+0.396
17.04%
1 Jan 2008 Jahr
2.213
-0.505
-18.57%
1 Jan 2009 Jahr
3.618
+1.405
63.48%
1 Jan 2010 Jahr
2.972
-0.646
-17.86%
1 Jan 2011 Jahr
3.966
+0.995
33.47%
1 Jan 2012 Jahr
3.656
-0.31
-7.82%
1 Jan 2013 Jahr
5.701
+2.045
55.94%
1 Jan 2014 Jahr
7.048
+1.347
23.62%
1 Jan 2015 Jahr
9.8
+2.752
39.04%
Bewertung der Länder gemäß mit laufender Statistik nach Jahren


Kommentare: