29
/de/
de
AIzaSyAYiBZKx7MnpbEhh9jyipgxe19OcubqV5w
April 1, 2024
229095
Romania
ROU
true
2
1
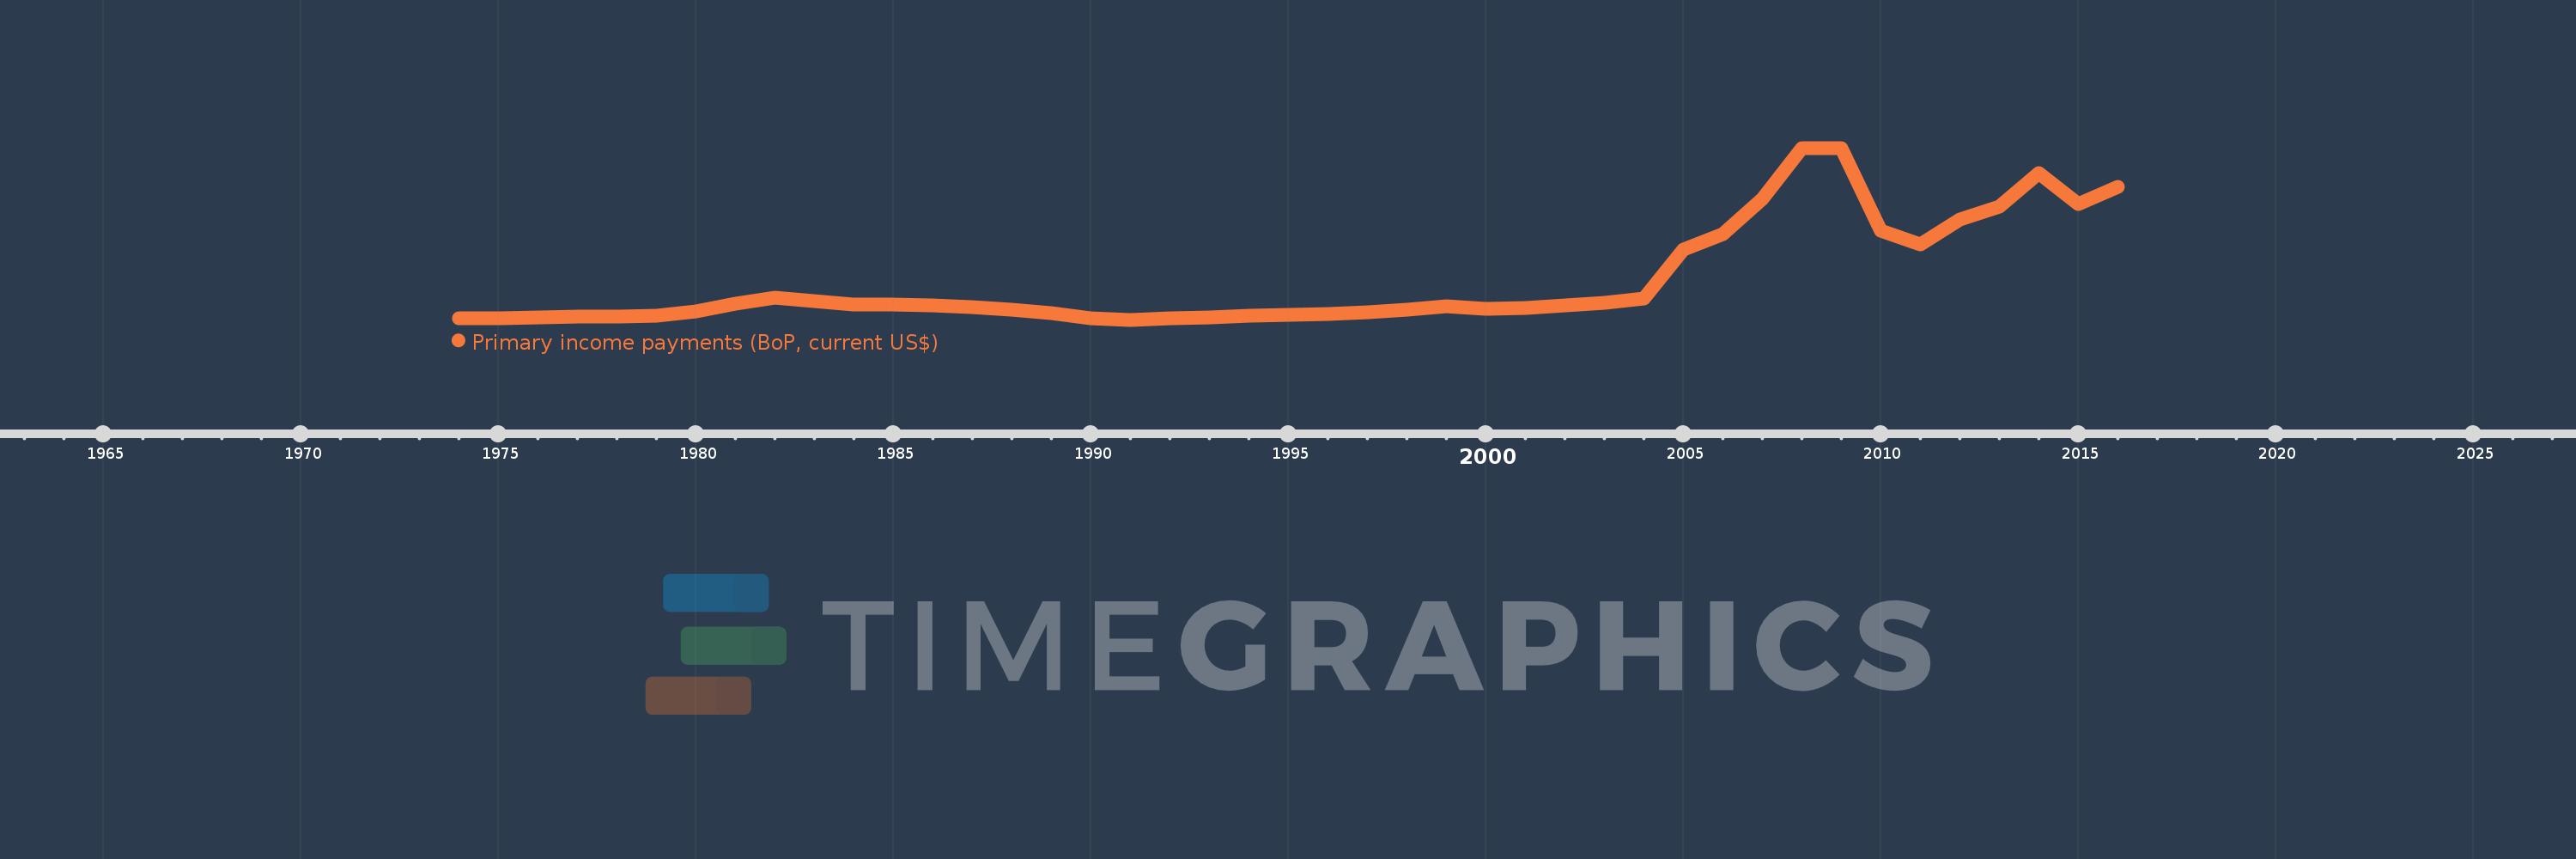
Primary income payments (BoP, current US$)
2016,2015,2014,2013,2012,2011,2010,2009,2008,2007,2006,2005,2004,2003,2002,2001,2000,1999,1998,1997,1996,1995,1994,1993,1992,1991,1990,1989,1988,1987,1986,1985,1984,1983,1982,1981,1980,1979,1978,1977,1976,1975,1974
Diese Statistik in anderen Ländern:
AfghanistanAlbaniaAlgeriaAngolaAntigua and BarbudaArab WorldArgentinaArmeniaArubaAustraliaAustriaAzerbaijanBahamas, TheBahrainBangladeshBarbadosBelarusBelgiumBelizeBeninBermudaBhutanBoliviaBosnia and HerzegovinaBotswanaBrazilBrunei DarussalamBulgariaBurkina FasoBurundiCabo VerdeCambodiaCameroonCanadaCaribbean small statesCentral African RepublicCentral Europe and the BalticsChadChileChinaColombiaComorosCongo, Dem. Rep.Congo, Rep.Costa RicaCote d'IvoireCroatiaCuracaoCyprusCzech RepublicDenmarkDjiboutiDominicaDominican RepublicEarly-demographic dividendEast Asia & PacificEast Asia & Pacific (excluding high income)East Asia & Pacific (IDA & IBRD countries)EcuadorEgypt, Arab Rep.El SalvadorEquatorial GuineaEritreaEstoniaEthiopiaEuro areaEurope & Central AsiaEurope & Central Asia (excluding high income)Europe & Central Asia (IDA & IBRD countries)European UnionFaroe IslandsFijiFinlandFragile and conflict affected situationsFranceFrench PolynesiaGabonGambia, TheGeorgiaGermanyGhanaGreeceGrenadaGuatemalaGuineaGuinea-BissauGuyanaHaitiHeavily indebted poor countries (HIPC)High incomeHondurasHong Kong SAR, ChinaHungaryIBRD onlyIcelandIDA & IBRD totalIDA blendIDA onlyIDA totalIndiaIndonesiaIran, Islamic Rep.IraqIrelandIsraelItalyJamaicaJapanJordanKazakhstanKenyaKiribatiKorea, Rep.KosovoKuwaitKyrgyz RepublicLao PDRLate-demographic dividendLatin America & Caribbean Latin America & Caribbean (excluding high income)Latin America & the Caribbean (IDA & IBRD countries)LatviaLeast developed countries: UN classificationLebanonLesothoLiberiaLibyaLithuaniaLow & middle incomeLow incomeLower middle incomeLuxembourgMacao SAR, ChinaMacedonia, FYRMadagascarMalawiMalaysiaMaldivesMaliMaltaMarshall IslandsMauritaniaMauritiusMexicoMicronesia, Fed. Sts.Middle East & North AfricaMiddle East & North Africa (excluding high income)Middle East & North Africa (IDA & IBRD countries)Middle incomeMoldovaMongoliaMontenegroMoroccoMozambiqueMyanmarNamibiaNepalNetherlandsNew CaledoniaNew ZealandNicaraguaNigerNigeriaNorth AmericaNorwayOECD membersOmanOther small statesPacific island small statesPakistanPalauPanamaPapua New GuineaParaguayPeruPhilippinesPolandPortugalPost-demographic dividendPre-demographic dividendQatarRomaniaRussian FederationRwandaSamoaSao Tome and PrincipeSaudi ArabiaSenegalSerbiaSeychellesSierra LeoneSingaporeSint Maarten (Dutch part)Slovak RepublicSloveniaSmall statesSolomon IslandsSouth AfricaSouth AsiaSouth Asia (IDA & IBRD)South SudanSpainSri LankaSt. Kitts and NevisSt. LuciaSt. Vincent and the GrenadinesSub-Saharan Africa Sub-Saharan Africa (excluding high income)Sub-Saharan Africa (IDA & IBRD countries)SudanSurinameSwazilandSwedenSwitzerlandSyrian Arab RepublicTajikistanTanzaniaThailandTimor-LesteTogoTongaTrinidad and TobagoTunisiaTurkeyTuvaluUgandaUkraineUnited KingdomUnited StatesUpper middle incomeUruguayVanuatuVenezuela, RBVietnamWest Bank and GazaWorldYemen, Rep.ZambiaZimbabwe Zeitlinie:
Diese Zeitleiste vorliegt die Graphik ab 1974 J. bis 2016 J. Romania. Die Angaben bis 1973 J. sind nicht vorhanden. Die Zahl aktueller Beobachtungen nach Daten: 43.
Die Quelle (Bezeichnung):
Kennzahlen der Weltentwicklung
Die Quelle (Einrichtung):
International Monetary Fund, Balance of Payments Statistics Yearbook and data files.
Kategorien:
Economy & Growth
Es wurde aktualisiert:
23 Apr 2017 Jahr
Kennzahlen der Wertänderungen vom Jahr zum Jahr
im Durchschnitt:
1.989 Mlrd.
Minimum:
14.0 Mln.
1 Jan 1991 Jahr
Maximum:
8.733 Mlrd.
1 Jan 2009 Jahr
Zum Datum der Beobachtung
Wert
Absolute Veränderung
Die Veränderung bezüglich dem vorherigen Wert
1 Jan 1974 Jahr
74.0 Mln.
+74.0 Mln.
0.0%
1 Jan 1975 Jahr
87.0 Mln.
+13.0 Mln.
17.57%
1 Jan 1976 Jahr
114.0 Mln.
+27.0 Mln.
31.03%
1 Jan 1977 Jahr
155.0 Mln.
+41.0 Mln.
35.96%
1 Jan 1978 Jahr
182.0 Mln.
+27.0 Mln.
17.42%
1 Jan 1979 Jahr
224.0 Mln.
+42.0 Mln.
23.08%
1 Jan 1980 Jahr
435.0 Mln.
+211.0 Mln.
94.2%
1 Jan 1981 Jahr
850.0 Mln.
+415.0 Mln.
95.4%
1 Jan 1982 Jahr
1.13 Mlrd.
+280.0 Mln.
32.94%
1 Jan 1983 Jahr
970.0 Mln.
-160.0 Mln.
-14.16%
1 Jan 1984 Jahr
807.0 Mln.
-163.0 Mln.
-16.8%
1 Jan 1985 Jahr
776.0 Mln.
-31.0 Mln.
-3.84%
1 Jan 1986 Jahr
729.0 Mln.
-47.0 Mln.
-6.06%
1 Jan 1987 Jahr
662.0 Mln.
-67.0 Mln.
-9.19%
1 Jan 1988 Jahr
528.0 Mln.
-134.0 Mln.
-20.24%
1 Jan 1989 Jahr
371.0 Mln.
-157.0 Mln.
-29.73%
1 Jan 1990 Jahr
101.0 Mln.
-270.0 Mln.
-72.78%
1 Jan 1991 Jahr
14.0 Mln.
-87.0 Mln.
-86.14%
1 Jan 1992 Jahr
89.0 Mln.
+75.0 Mln.
535.71%
1 Jan 1993 Jahr
144.0 Mln.
+55.0 Mln.
61.8%
1 Jan 1994 Jahr
208.0 Mln.
+64.0 Mln.
44.44%
1 Jan 1995 Jahr
245.0 Mln.
+37.0 Mln.
17.79%
1 Jan 1996 Jahr
322.0 Mln.
+77.0 Mln.
31.43%
1 Jan 1997 Jahr
387.0 Mln.
+65.0 Mln.
20.19%
1 Jan 1998 Jahr
526.0 Mln.
+139.0 Mln.
35.92%
1 Jan 1999 Jahr
705.0 Mln.
+179.0 Mln.
34.03%
1 Jan 2000 Jahr
563.0 Mln.
-142.0 Mln.
-20.14%
1 Jan 2001 Jahr
610.0 Mln.
+47.0 Mln.
8.35%
1 Jan 2002 Jahr
737.0 Mln.
+127.0 Mln.
20.82%
1 Jan 2003 Jahr
872.0 Mln.
+135.0 Mln.
18.32%
1 Jan 2004 Jahr
1.077 Mlrd.
+205.0 Mln.
23.51%
1 Jan 2005 Jahr
3.582 Mlrd.
+2.505 Mlrd.
232.59%
1 Jan 2006 Jahr
4.354 Mlrd.
+772.306 Mln.
21.56%
1 Jan 2007 Jahr
6.127 Mlrd.
+1.772 Mlrd.
40.7%
1 Jan 2008 Jahr
8.71 Mlrd.
+2.583 Mlrd.
42.16%
1 Jan 2009 Jahr
8.733 Mlrd.
+23.354 Mln.
0.27%
1 Jan 2010 Jahr
4.533 Mlrd.
-4.2 Mlrd.
-48.09%
1 Jan 2011 Jahr
3.819 Mlrd.
-714.334 Mln.
-15.76%
1 Jan 2012 Jahr
5.098 Mlrd.
+1.28 Mlrd.
33.51%
1 Jan 2013 Jahr
5.761 Mlrd.
+662.659 Mln.
13.0%
1 Jan 2014 Jahr
7.477 Mlrd.
+1.716 Mlrd.
29.79%
1 Jan 2015 Jahr
5.899 Mlrd.
-1.578 Mlrd.
-21.11%
1 Jan 2016 Jahr
6.752 Mlrd.
+852.6 Mln.
14.45%
Bewertung der Länder gemäß mit laufender Statistik nach Jahren


Kommentare: