29
/de/
de
AIzaSyAYiBZKx7MnpbEhh9jyipgxe19OcubqV5w
April 1, 2024
224435
Philippines
PHL
true
2
1
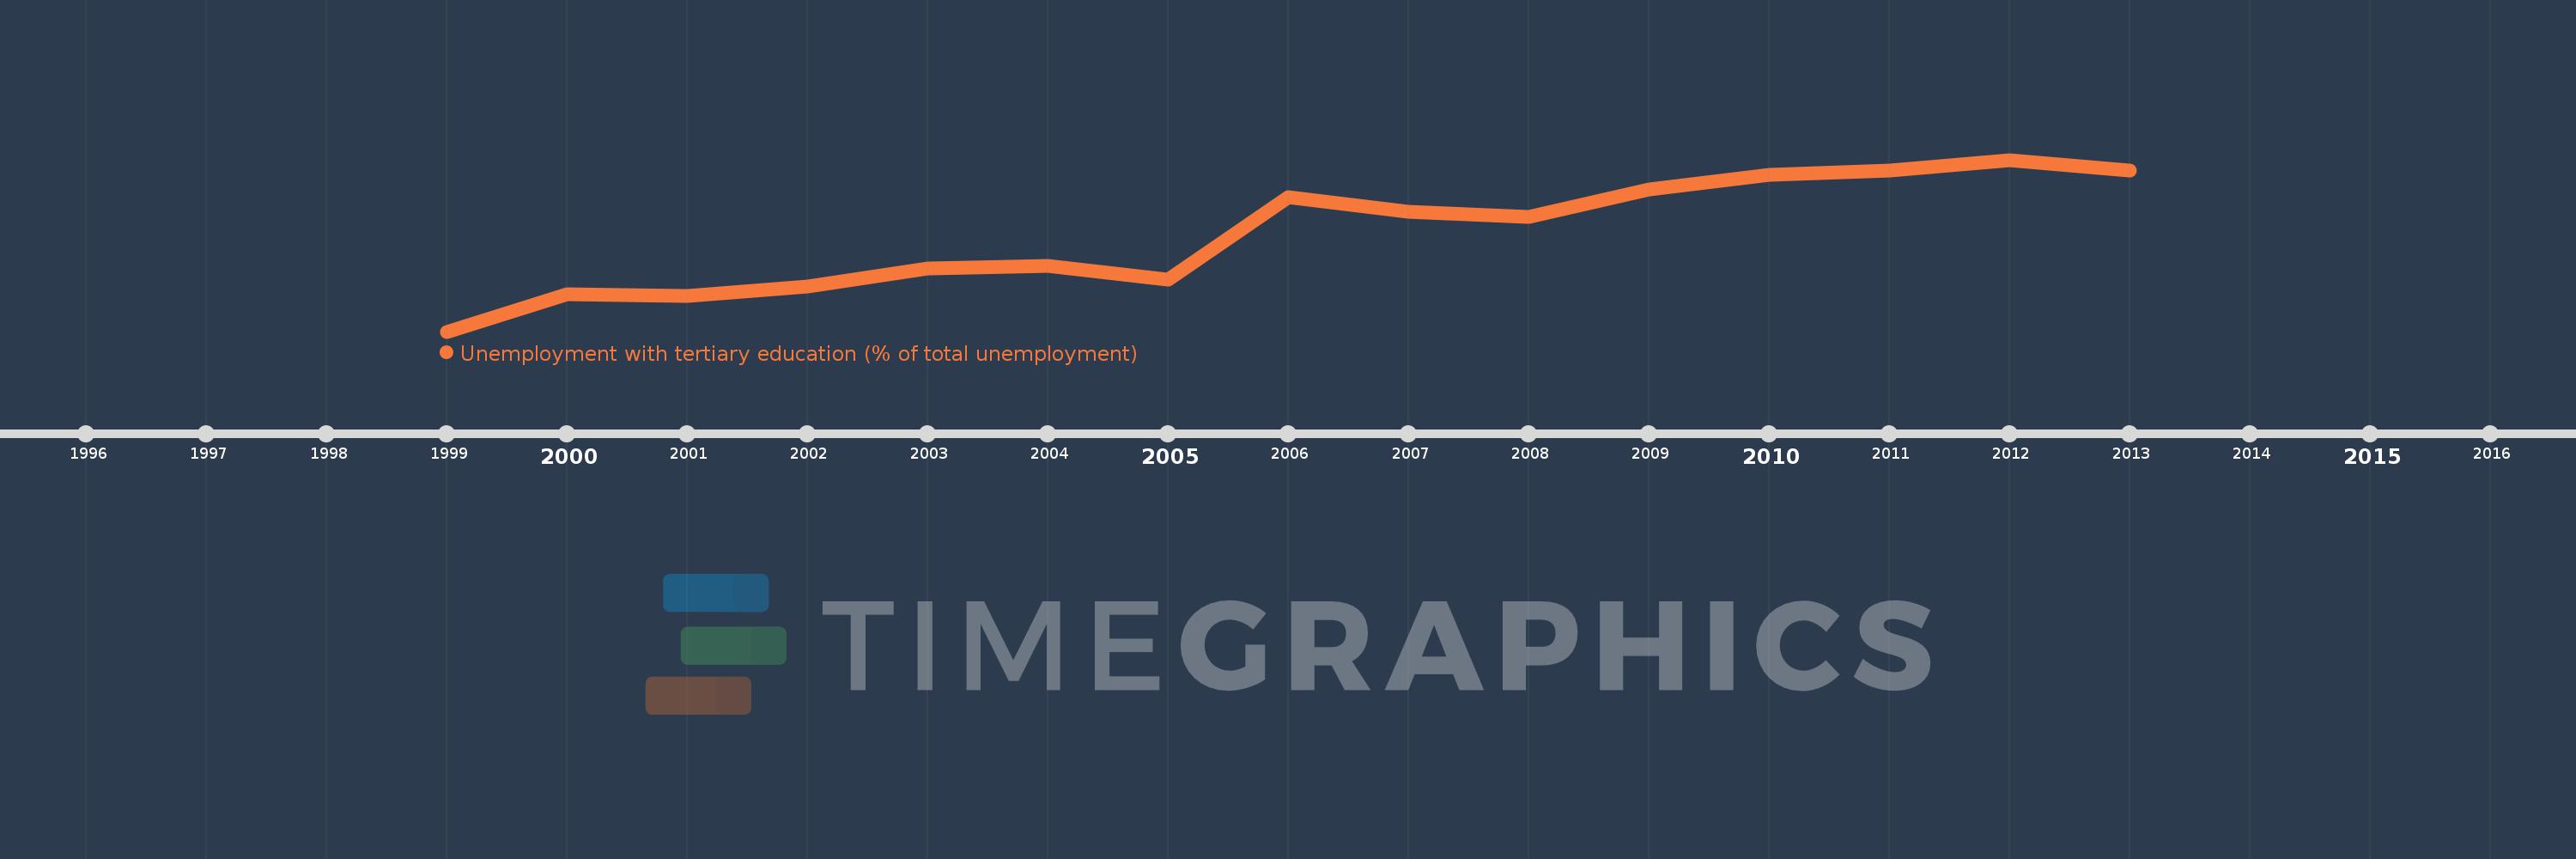
Unemployment with tertiary education (% of total unemployment)
2013,2012,2011,2010,2009,2008,2007,2006,2005,2004,2003,2002,2001,2000,1999
Diese Statistik in anderen Ländern:
Zeitlinie:
Diese Zeitleiste vorliegt die Graphik ab 1999 J. bis 2013 J. Philippines. Die Angaben bis 1998 J. sind nicht vorhanden. Die Zahl aktueller Beobachtungen nach Daten: 15.
Die Quelle (Bezeichnung):
Kennzahlen der Weltentwicklung
Die Quelle (Einrichtung):
International Labour Organization, Key Indicators of the Labour Market database.
Kategorien:
Social Protection & Labor
Es wurde aktualisiert:
23 Apr 2017 Jahr
Kennzahlen der Wertänderungen vom Jahr zum Jahr
Minimum:
30.5
1 Jan 1999 Jahr
Maximum:
42.0
1 Jan 2012 Jahr
Zum Datum der Beobachtung
Wert
Absolute Veränderung
Die Veränderung bezüglich dem vorherigen Wert
1 Jan 1999 Jahr
30.5
+30.5
0.0%
1 Jan 2000 Jahr
33.0
+2.5
8.2%
1 Jan 2001 Jahr
32.9
-0.1
-0.3%
1 Jan 2002 Jahr
33.5
+0.6
1.82%
1 Jan 2003 Jahr
34.7
+1.2
3.58%
1 Jan 2004 Jahr
34.9
+0.2
0.58%
1 Jan 2005 Jahr
34.0
-0.9
-2.58%
1 Jan 2006 Jahr
39.5
+5.5
16.18%
1 Jan 2007 Jahr
38.5
-1.0
-2.53%
1 Jan 2008 Jahr
38.2
-0.3
-0.78%
1 Jan 2009 Jahr
40.0
+1.8
4.71%
1 Jan 2010 Jahr
41.0
+1.0
2.5%
1 Jan 2011 Jahr
41.3
+0.3
0.73%
1 Jan 2012 Jahr
42.0
+0.7
1.69%
1 Jan 2013 Jahr
41.3
-0.7
-1.67%
Bewertung der Länder gemäß mit laufender Statistik nach Jahren


Kommentare: