29
/de/
de
AIzaSyAYiBZKx7MnpbEhh9jyipgxe19OcubqV5w
April 1, 2024
224196
Philippines
PHL
true
2
1
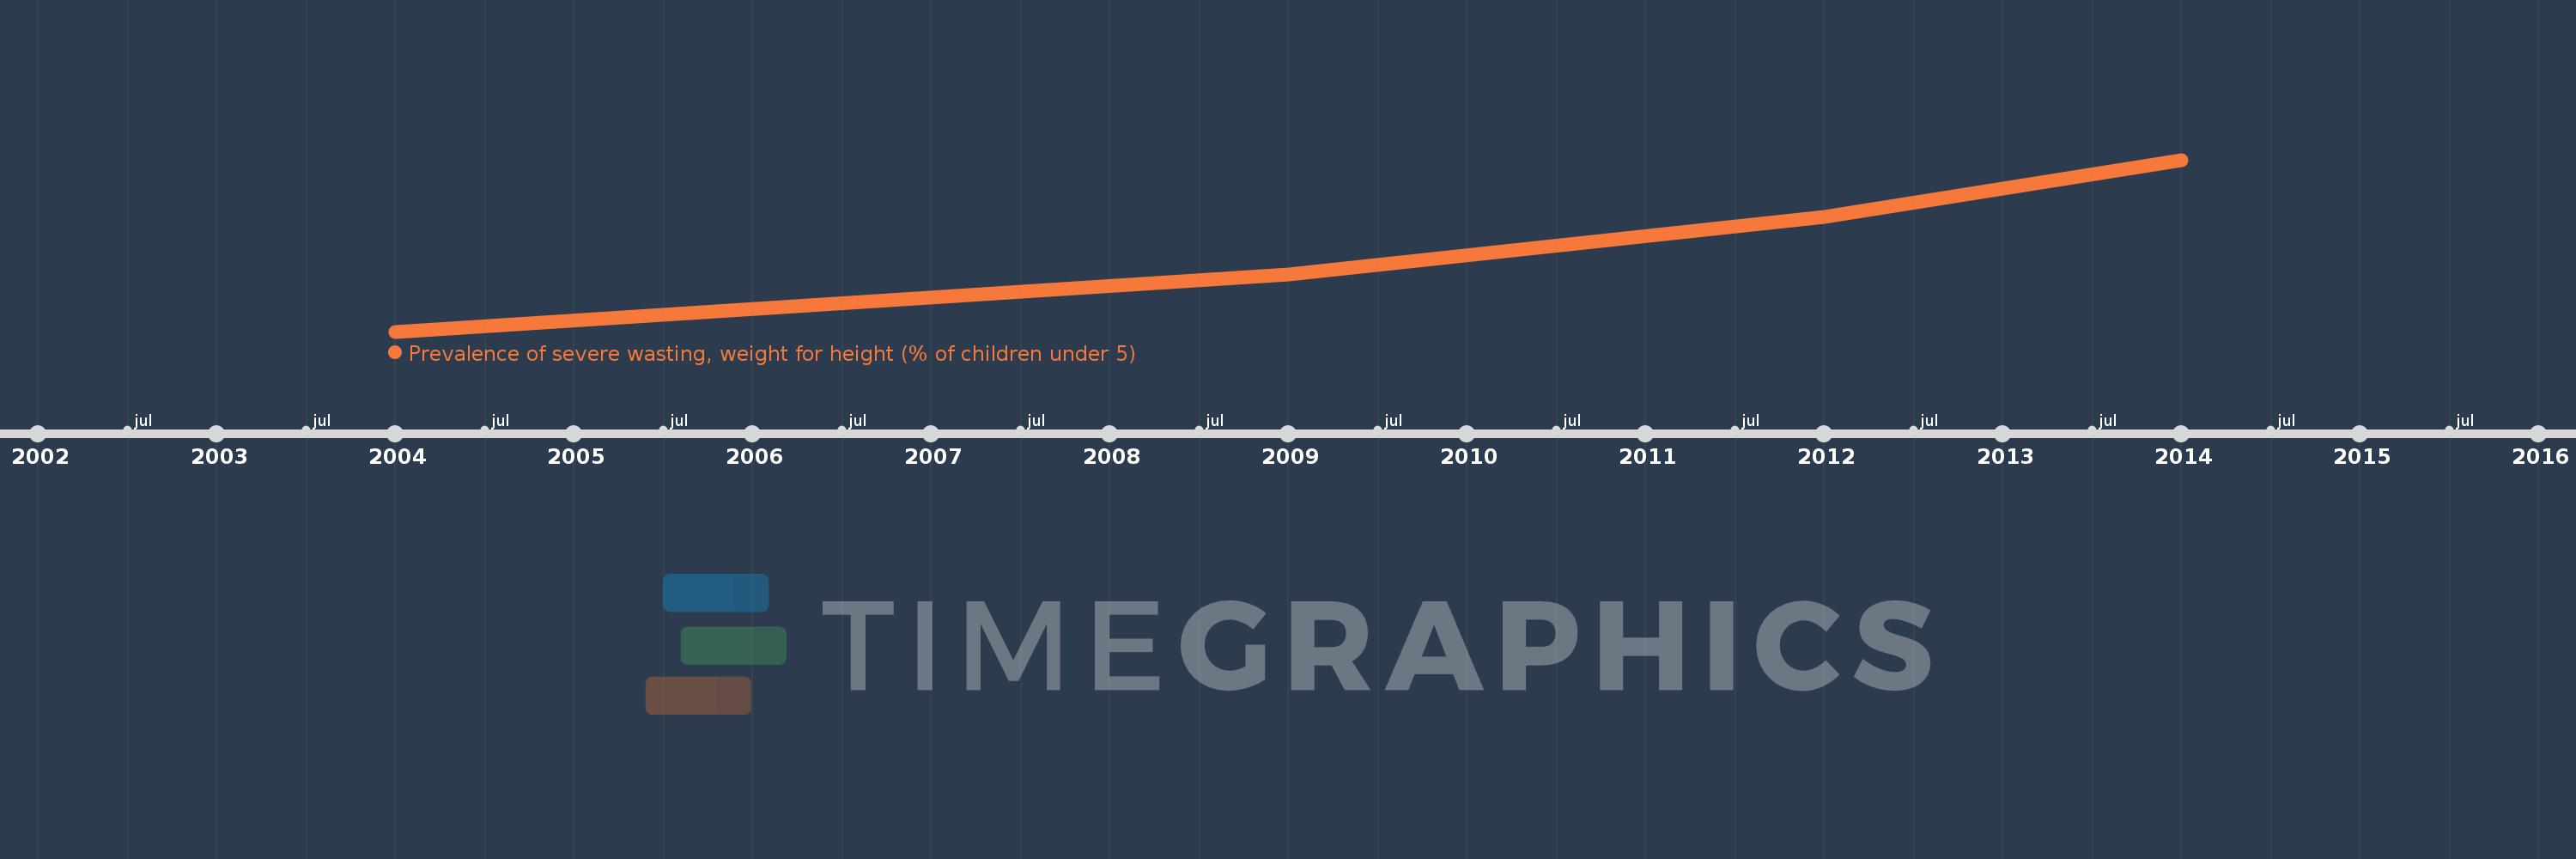
Prevalence of severe wasting, weight for height (% of children under 5)
2014,2012,2009,2004
Diese Statistik in anderen Ländern:
Zeitlinie:
Diese Zeitleiste vorliegt die Graphik ab 2004 J. bis 2014 J. Philippines. Die Angaben bis 2003 J. sind nicht vorhanden. Die Zahl aktueller Beobachtungen nach Daten: 4.
Die Quelle (Bezeichnung):
Kennzahlen der Weltentwicklung
Die Quelle (Einrichtung):
World Health Organization, Global Database on Child Growth and Malnutrition. Country-level data are unadjusted data from national surveys, and thus may not be comparable across countries. Adjusted, comparable data are available at http://www.who.int/nutgrowthdb/en. Aggregation is based on UNICEF, WHO, and the World Bank harmonized dataset (adjusted, comparable data) and methodology.
Kategorien:
Health
Es wurde aktualisiert:
23 Apr 2017 Jahr
Kennzahlen der Wertänderungen vom Jahr zum Jahr
Minimum:
1.6
1 Jan 2004 Jahr
Maximum:
2.8
1 Jan 2014 Jahr
Zum Datum der Beobachtung
Wert
Absolute Veränderung
Die Veränderung bezüglich dem vorherigen Wert
1 Jan 2004 Jahr
1.6
+1.6
0.0%
1 Jan 2009 Jahr
2.0
+0.4
25.0%
1 Jan 2012 Jahr
2.4
+0.4
20.0%
1 Jan 2014 Jahr
2.8
+0.4
16.67%
Bewertung der Länder gemäß mit laufender Statistik nach Jahren


Kommentare: