29
/de/
de
AIzaSyAYiBZKx7MnpbEhh9jyipgxe19OcubqV5w
April 1, 2024
224064
Philippines
PHL
true
2
1
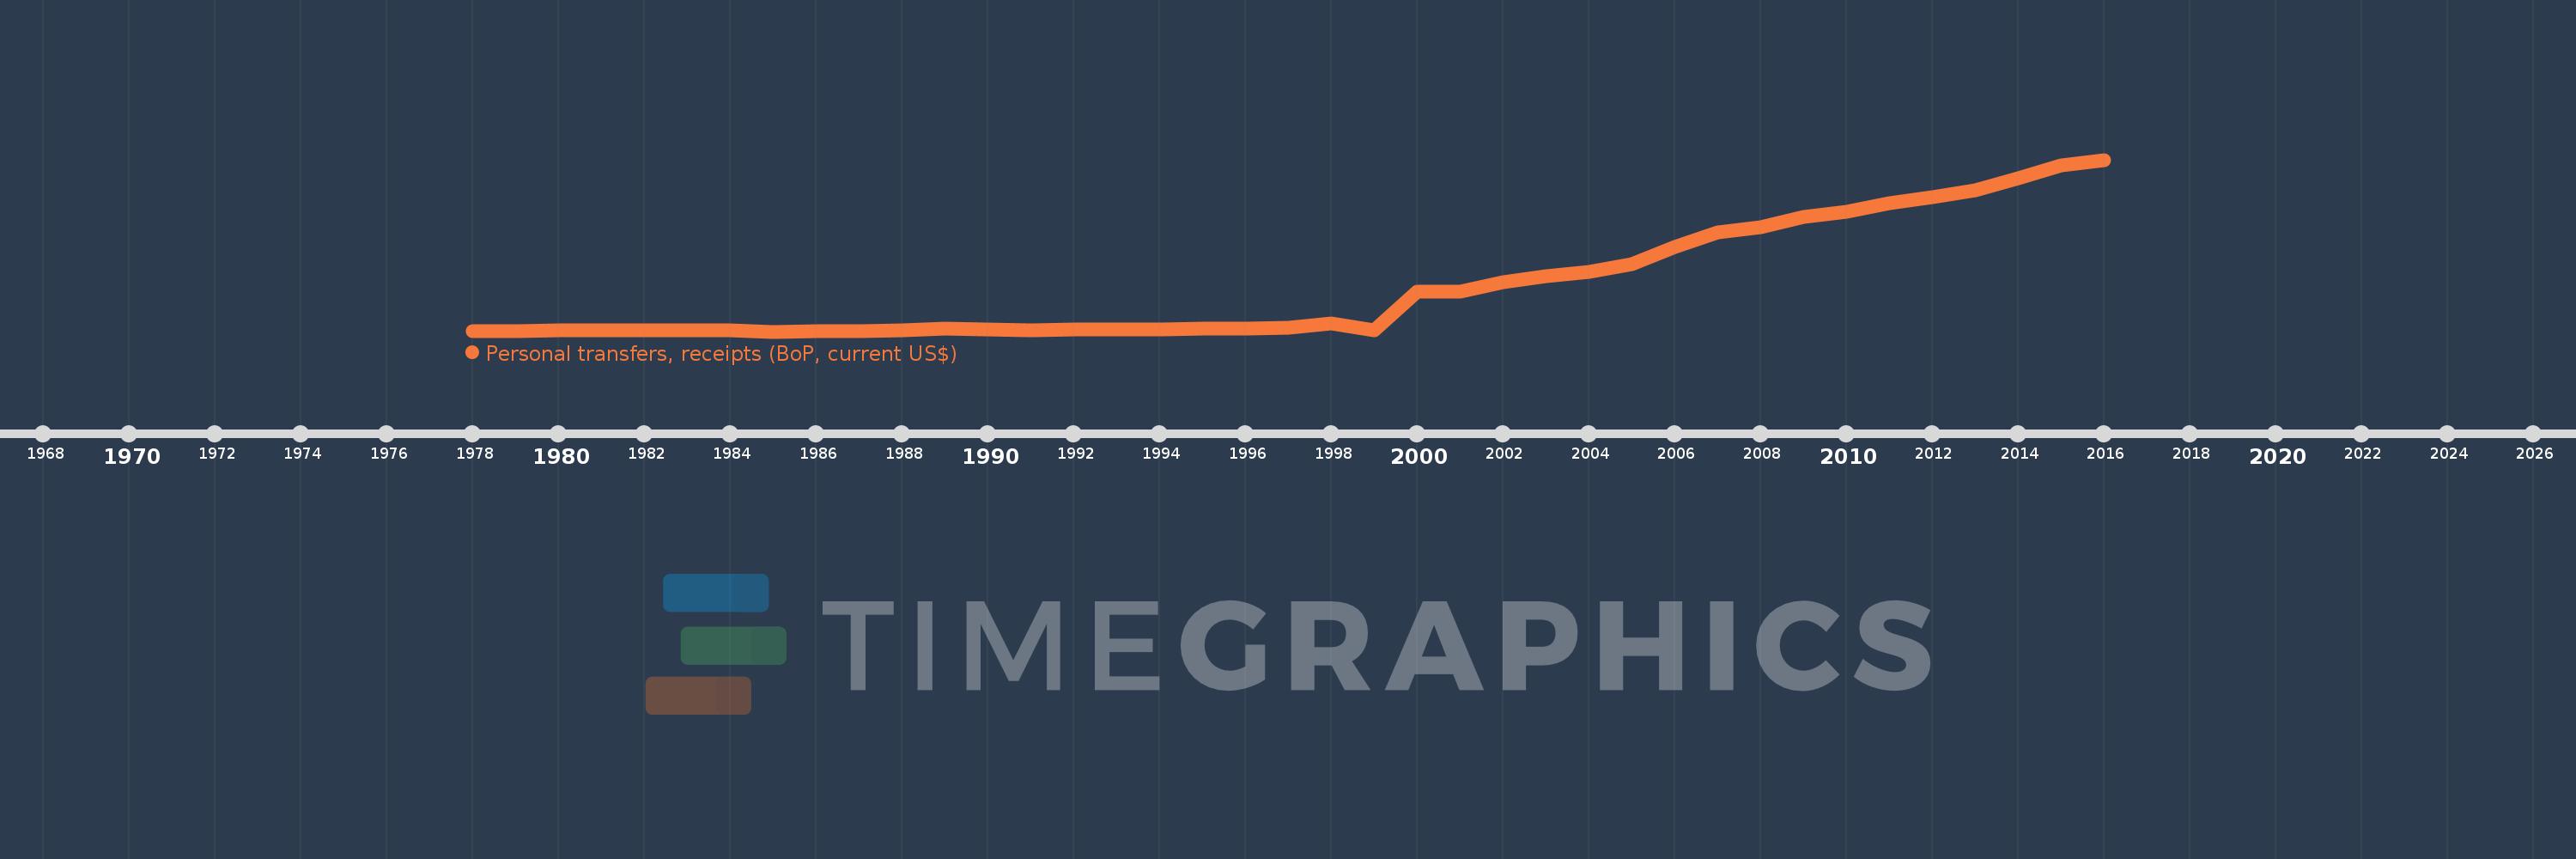
Personal transfers, receipts (BoP, current US$)
2016,2015,2014,2013,2012,2011,2010,2009,2008,2007,2006,2005,2004,2003,2002,2001,2000,1999,1998,1997,1996,1995,1994,1993,1992,1991,1990,1989,1988,1987,1986,1985,1984,1983,1982,1981,1980,1979,1978
Diese Statistik in anderen Ländern:
Zeitlinie:
Diese Zeitleiste vorliegt die Graphik ab 1978 J. bis 2016 J. Philippines. Die Angaben bis 1977 J. sind nicht vorhanden. Die Zahl aktueller Beobachtungen nach Daten: 39.
Die Quelle (Bezeichnung):
Kennzahlen der Weltentwicklung
Die Quelle (Einrichtung):
International Monetary Fund, Balance of Payments Statistics Yearbook and data files.
Kategorien:
Economy & Growth, Financial Sector
Es wurde aktualisiert:
23 Apr 2017 Jahr
Kennzahlen der Wertänderungen vom Jahr zum Jahr
im Durchschnitt:
5.858 Mlrd.
Minimum:
59.0 Mln.
1 Jan 1985 Jahr
Maximum:
21.991 Mlrd.
1 Jan 2016 Jahr
Zum Datum der Beobachtung
Wert
Absolute Veränderung
Die Veränderung bezüglich dem vorherigen Wert
1 Jan 1978 Jahr
125.0 Mln.
+125.0 Mln.
0.0%
1 Jan 1979 Jahr
154.0 Mln.
+29.0 Mln.
23.2%
1 Jan 1980 Jahr
191.0 Mln.
+37.0 Mln.
24.03%
1 Jan 1981 Jahr
205.0 Mln.
+14.0 Mln.
7.33%
1 Jan 1982 Jahr
254.0 Mln.
+49.0 Mln.
23.9%
1 Jan 1983 Jahr
239.0 Mln.
-15.0 Mln.
-5.91%
1 Jan 1984 Jahr
180.0 Mln.
-59.0 Mln.
-24.69%
1 Jan 1985 Jahr
59.0 Mln.
-121.0 Mln.
-67.22%
1 Jan 1986 Jahr
111.0 Mln.
+52.0 Mln.
88.14%
1 Jan 1987 Jahr
163.0 Mln.
+52.0 Mln.
46.85%
1 Jan 1988 Jahr
211.0 Mln.
+48.0 Mln.
29.45%
1 Jan 1989 Jahr
388.0 Mln.
+177.0 Mln.
83.89%
1 Jan 1990 Jahr
360.0 Mln.
-28.0 Mln.
-7.22%
1 Jan 1991 Jahr
262.0 Mln.
-98.0 Mln.
-27.22%
1 Jan 1992 Jahr
329.0 Mln.
+67.0 Mln.
25.57%
1 Jan 1993 Jahr
315.0 Mln.
-14.0 Mln.
-4.26%
1 Jan 1994 Jahr
311.0 Mln.
-4.0 Mln.
-1.27%
1 Jan 1995 Jahr
443.0 Mln.
+132.0 Mln.
42.44%
1 Jan 1996 Jahr
432.0 Mln.
-11.0 Mln.
-2.48%
1 Jan 1997 Jahr
569.0 Mln.
+137.0 Mln.
31.71%
1 Jan 1998 Jahr
1.057 Mlrd.
+488.0 Mln.
85.76%
1 Jan 1999 Jahr
204.0 Mln.
-853.0 Mln.
-80.7%
1 Jan 2000 Jahr
5.212 Mlrd.
+5.008 Mlrd.
2.45 Tsnd.%
1 Jan 2001 Jahr
5.161 Mlrd.
-51.0 Mln.
-0.98%
1 Jan 2002 Jahr
6.328 Mlrd.
+1.167 Mlrd.
22.61%
1 Jan 2003 Jahr
7.167 Mlrd.
+839.0 Mln.
13.26%
1 Jan 2004 Jahr
7.681 Mlrd.
+514.0 Mln.
7.17%
1 Jan 2005 Jahr
8.617 Mlrd.
+936.0 Mln.
12.19%
1 Jan 2006 Jahr
10.838 Mlrd.
+2.221 Mlrd.
25.78%
1 Jan 2007 Jahr
12.723 Mlrd.
+1.885 Mlrd.
17.39%
1 Jan 2008 Jahr
13.403 Mlrd.
+679.821 Mln.
5.34%
1 Jan 2009 Jahr
14.751 Mlrd.
+1.348 Mlrd.
10.05%
1 Jan 2010 Jahr
15.369 Mlrd.
+618.157 Mln.
4.19%
1 Jan 2011 Jahr
16.415 Mlrd.
+1.047 Mlrd.
6.81%
1 Jan 2012 Jahr
17.201 Mlrd.
+785.331 Mln.
4.78%
1 Jan 2013 Jahr
18.086 Mlrd.
+884.846 Mln.
5.14%
1 Jan 2014 Jahr
19.678 Mlrd.
+1.593 Mlrd.
8.81%
1 Jan 2015 Jahr
21.271 Mlrd.
+1.593 Mlrd.
8.09%
1 Jan 2016 Jahr
21.991 Mlrd.
+719.515 Mln.
3.38%
Bewertung der Länder gemäß mit laufender Statistik nach Jahren


Kommentare: