Download Diese Statistik in anderen Ländern:
Zeitlinie:
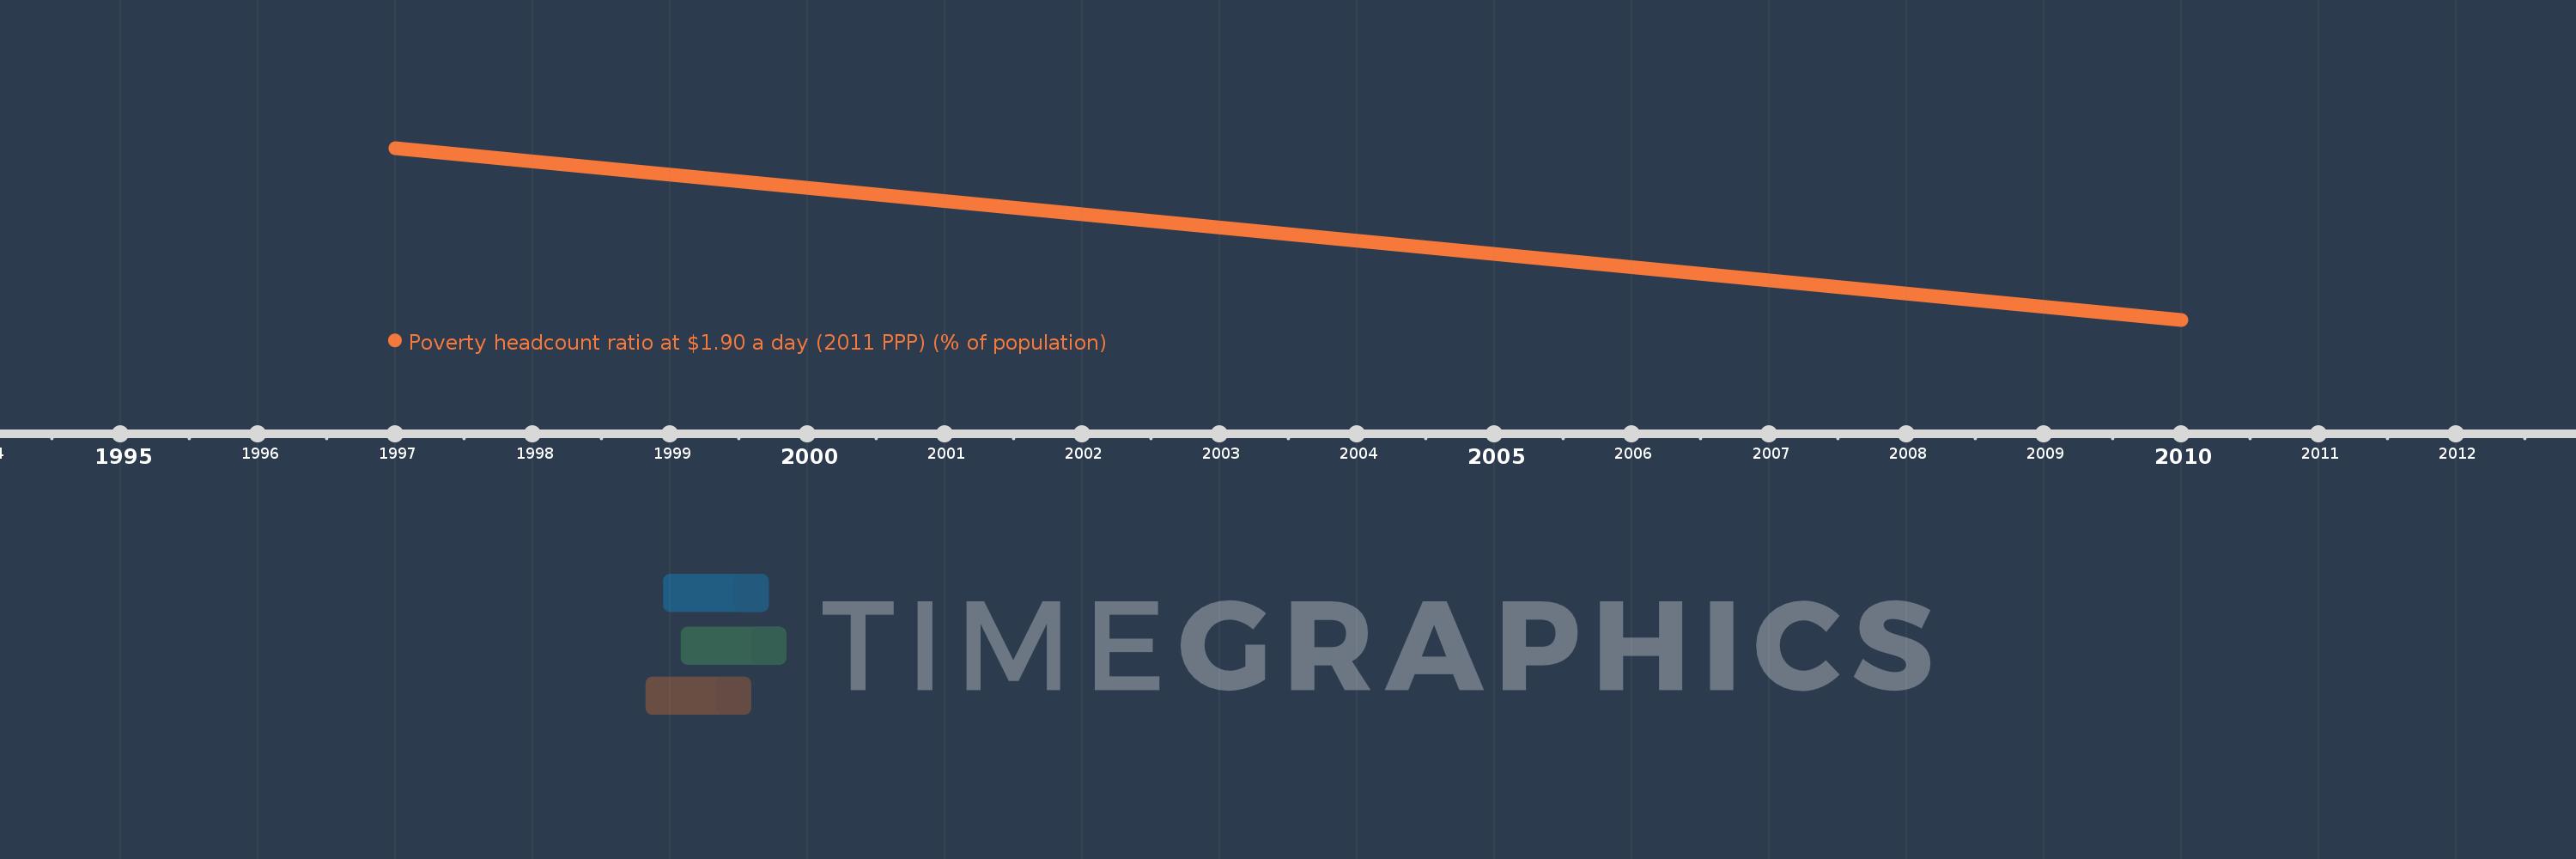
Diese Zeitleiste vorliegt die Graphik ab 1997 J. bis 2010 J. Papua New Guinea. Die Angaben bis 1996 J. sind nicht vorhanden. Die Zahl aktueller Beobachtungen nach Daten: 2.
Die Quelle (Bezeichnung):
Kennzahlen der Weltentwicklung
Die Quelle (Einrichtung):
World Bank, Development Research Group. Data are based on primary household survey data obtained from government statistical agencies and World Bank country departments. Data for high-income economies are from the Luxembourg Income Study database. For more information and methodology, please see PovcalNet (http://iresearch.worldbank.org/PovcalNet/index.htm).
Kategorien:
Poverty, Aid Effectiveness, Climate Change
Es wurde aktualisiert:
23 Apr 2017 Jahr
Kennzahlen der Wertänderungen vom Jahr zum Jahr
Minimum:
39.31
1 Jan 2010 Jahr
Maximum:
53.23
1 Jan 1997 Jahr
Zum Datum der Beobachtung
Wert
Absolute Veränderung
Die Veränderung bezüglich dem vorherigen Wert
1 Jan 1997 Jahr
53.23
+53.23
0.0%
1 Jan 2010 Jahr
39.31
-13.92
-26.15%
Bewertung der Länder gemäß mit laufender Statistik nach Jahren
