29
/de/
de
AIzaSyAYiBZKx7MnpbEhh9jyipgxe19OcubqV5w
April 1, 2024
218086
Panama
PAN
true
2
1
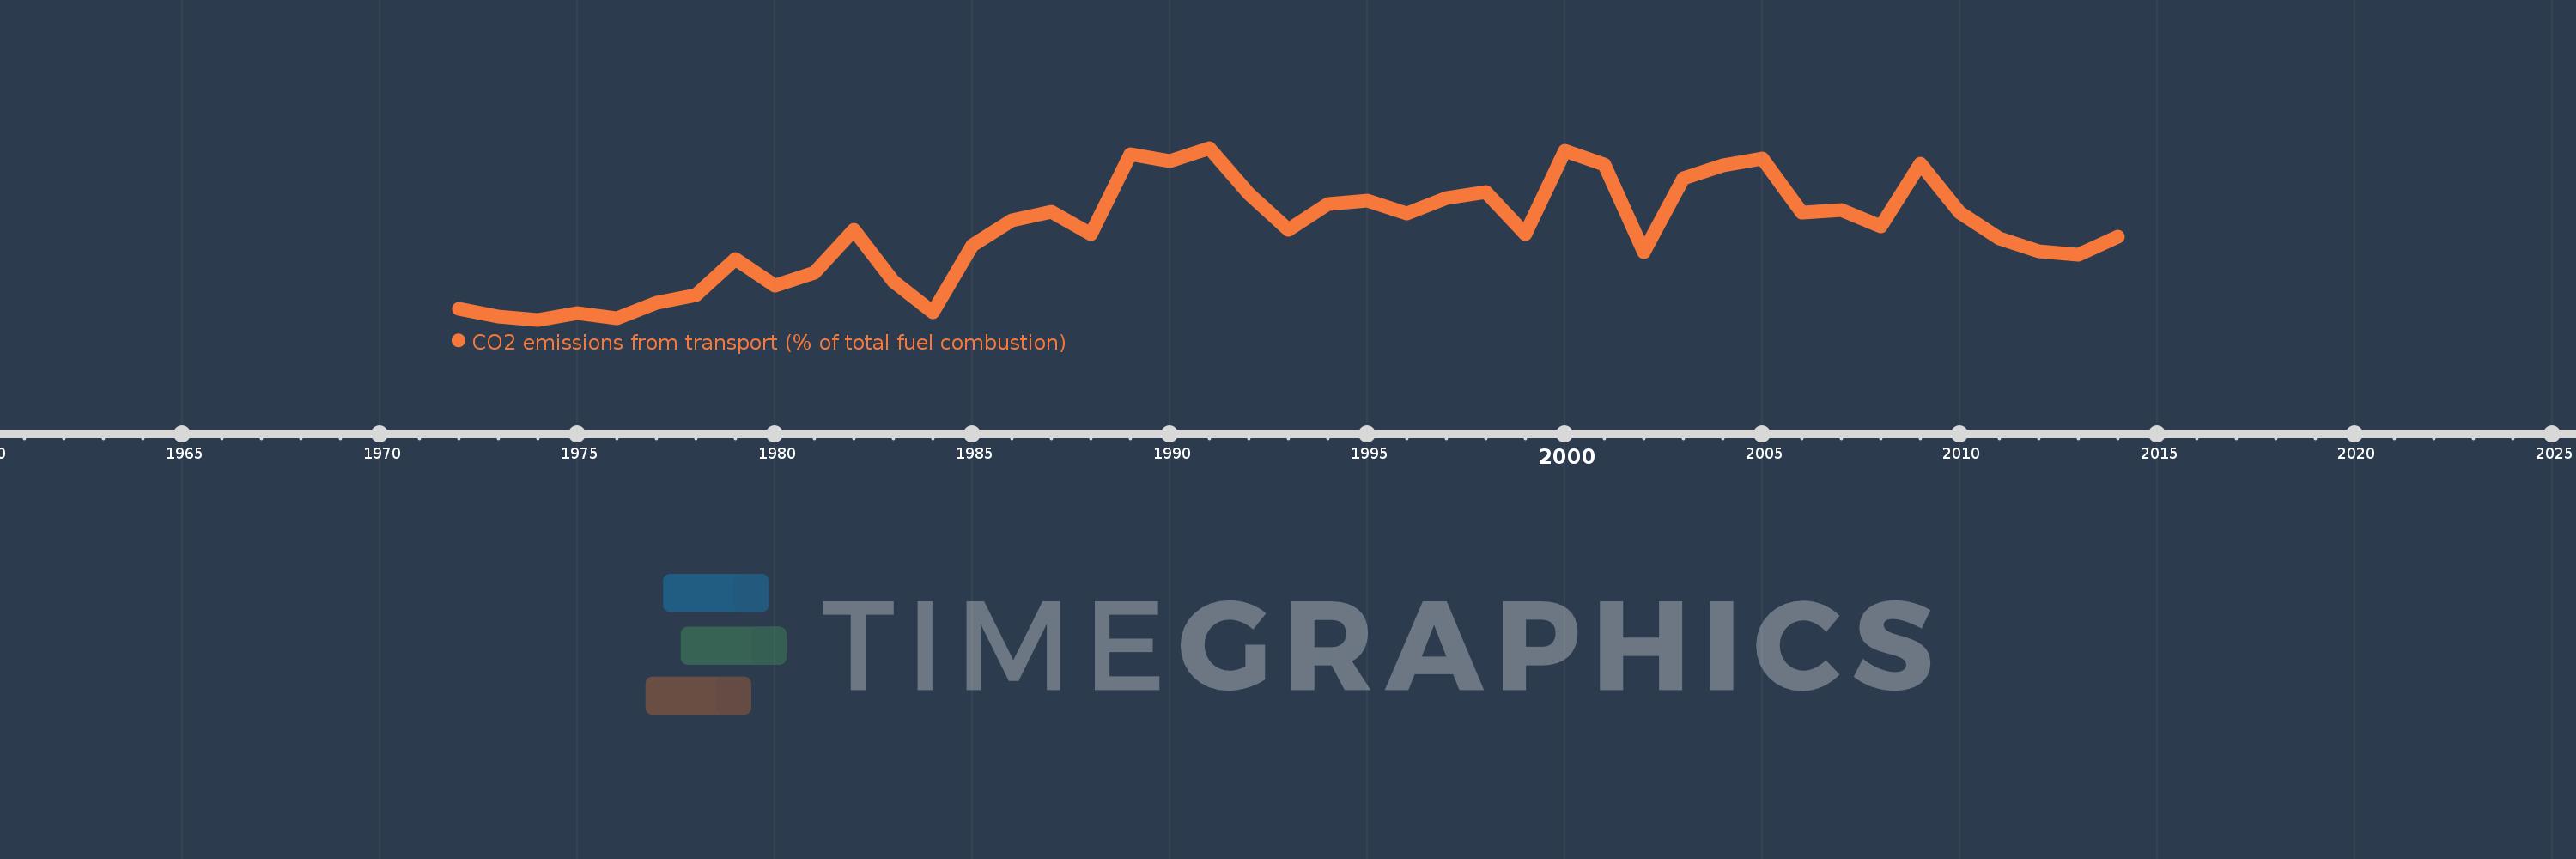
CO2 emissions from transport (% of total fuel combustion)
2014,2013,2012,2011,2010,2009,2008,2007,2006,2005,2004,2003,2002,2001,2000,1999,1998,1997,1996,1995,1994,1993,1992,1991,1990,1989,1988,1987,1986,1985,1984,1983,1982,1981,1980,1979,1978,1977,1976,1975,1974,1973,1972
Diese Statistik in anderen Ländern:
AlbaniaAlgeriaAngolaArab WorldArgentinaArmeniaAustraliaAustriaAzerbaijanBahrainBangladeshBelarusBelgiumBeninBoliviaBosnia and HerzegovinaBotswanaBrazilBrunei DarussalamBulgariaCambodiaCameroonCanadaCaribbean small statesCentral Europe and the BalticsChileChinaColombiaCongo, Dem. Rep.Congo, Rep.Costa RicaCote d'IvoireCroatiaCubaCuracaoCyprusCzech RepublicDenmarkDominican RepublicEarly-demographic dividendEast Asia & PacificEast Asia & Pacific (excluding high income)East Asia & Pacific (IDA & IBRD countries)EcuadorEgypt, Arab Rep.El SalvadorEritreaEstoniaEthiopiaEuro areaEurope & Central AsiaEurope & Central Asia (excluding high income)Europe & Central Asia (IDA & IBRD countries)European UnionFinlandFragile and conflict affected situationsFranceGabonGeorgiaGermanyGhanaGibraltarGreeceGuatemalaHaitiHeavily indebted poor countries (HIPC)High incomeHondurasHong Kong SAR, ChinaHungaryIBRD onlyIcelandIDA & IBRD totalIDA blendIDA onlyIDA totalIndiaIndonesiaIran, Islamic Rep.IraqIrelandIsraelItalyJamaicaJapanJordanKazakhstanKenyaKorea, Dem. People’s Rep.Korea, Rep.KosovoKuwaitKyrgyz RepublicLate-demographic dividendLatin America & Caribbean Latin America & Caribbean (excluding high income)Latin America & the Caribbean (IDA & IBRD countries)LatviaLeast developed countries: UN classificationLebanonLibyaLithuaniaLow & middle incomeLow incomeLower middle incomeLuxembourgMacedonia, FYRMalaysiaMaltaMauritiusMexicoMiddle East & North AfricaMiddle East & North Africa (excluding high income)Middle East & North Africa (IDA & IBRD countries)Middle incomeMoldovaMongoliaMontenegroMoroccoMozambiqueMyanmarNamibiaNepalNetherlandsNew ZealandNicaraguaNigerNigeriaNorth AmericaNorwayOECD membersOmanOther small statesPakistanPanamaParaguayPeruPhilippinesPolandPortugalPost-demographic dividendPre-demographic dividendQatarRomaniaRussian FederationSaudi ArabiaSenegalSerbiaSingaporeSlovak RepublicSloveniaSmall statesSouth AfricaSouth AsiaSouth Asia (IDA & IBRD)South SudanSpainSri LankaSub-Saharan Africa Sub-Saharan Africa (excluding high income)Sub-Saharan Africa (IDA & IBRD countries)SudanSwedenSwitzerlandSyrian Arab RepublicTajikistanTanzaniaThailandTogoTrinidad and TobagoTunisiaTurkeyTurkmenistanUkraineUnited Arab EmiratesUnited KingdomUnited StatesUpper middle incomeUruguayUzbekistanVenezuela, RBVietnamWorldYemen, Rep.ZambiaZimbabwe Zeitlinie:
Diese Zeitleiste vorliegt die Graphik ab 1972 J. bis 2014 J. Panama. Die Angaben bis 1971 J. sind nicht vorhanden. Die Zahl aktueller Beobachtungen nach Daten: 43.
Die Quelle (Bezeichnung):
Kennzahlen der Weltentwicklung
Die Quelle (Einrichtung):
IEA Statistics © OECD/IEA 2014 (http://www.iea.org/stats/index.asp), subject to https://www.iea.org/t&c/termsandconditions/
Kategorien:
Environment
Es wurde aktualisiert:
23 Apr 2017 Jahr
Kennzahlen der Wertänderungen vom Jahr zum Jahr
Minimum:
30.479
1 Jan 1974 Jahr
Maximum:
49.609
1 Jan 1991 Jahr
Zum Datum der Beobachtung
Wert
Absolute Veränderung
Die Veränderung bezüglich dem vorherigen Wert
1 Jan 1972 Jahr
31.727
+31.727
0.0%
1 Jan 1973 Jahr
30.827
-0.9
-2.84%
1 Jan 1974 Jahr
30.479
-0.348
-1.13%
1 Jan 1975 Jahr
31.208
+0.729
2.39%
1 Jan 1976 Jahr
30.645
-0.563
-1.8%
1 Jan 1977 Jahr
32.362
+1.717
5.6%
1 Jan 1978 Jahr
33.225
+0.862
2.66%
1 Jan 1979 Jahr
37.241
+4.017
12.09%
1 Jan 1980 Jahr
34.314
-2.928
-7.86%
1 Jan 1981 Jahr
35.739
+1.425
4.15%
1 Jan 1982 Jahr
40.476
+4.737
13.26%
1 Jan 1983 Jahr
34.797
-5.679
-14.03%
1 Jan 1984 Jahr
31.268
-3.529
-10.14%
1 Jan 1985 Jahr
38.79
+7.522
24.05%
1 Jan 1986 Jahr
41.573
+2.783
7.17%
1 Jan 1987 Jahr
42.545
+0.972
2.34%
1 Jan 1988 Jahr
40.0
-2.545
-5.98%
1 Jan 1989 Jahr
48.954
+8.954
22.38%
1 Jan 1990 Jahr
48.193
-0.761
-1.55%
1 Jan 1991 Jahr
49.609
+1.417
2.94%
1 Jan 1992 Jahr
44.482
-5.128
-10.34%
1 Jan 1993 Jahr
40.51
-3.972
-8.93%
1 Jan 1994 Jahr
43.38
+2.87
7.09%
1 Jan 1995 Jahr
43.767
+0.386
0.89%
1 Jan 1996 Jahr
42.298
-1.468
-3.35%
1 Jan 1997 Jahr
44.068
+1.77
4.18%
1 Jan 1998 Jahr
44.7
+0.633
1.44%
1 Jan 1999 Jahr
40.0
-4.7
-10.52%
1 Jan 2000 Jahr
49.254
+9.254
23.13%
1 Jan 2001 Jahr
47.746
-1.508
-3.06%
1 Jan 2002 Jahr
37.99
-9.756
-20.43%
1 Jan 2003 Jahr
46.275
+8.285
21.81%
1 Jan 2004 Jahr
47.692
+1.418
3.06%
1 Jan 2005 Jahr
48.393
+0.701
1.47%
1 Jan 2006 Jahr
42.433
-5.96
-12.32%
1 Jan 2007 Jahr
42.697
+0.263
0.62%
1 Jan 2008 Jahr
40.902
-1.794
-4.2%
1 Jan 2009 Jahr
47.853
+6.95
16.99%
1 Jan 2010 Jahr
42.375
-5.478
-11.45%
1 Jan 2011 Jahr
39.551
-2.824
-6.67%
1 Jan 2012 Jahr
38.115
-1.435
-3.63%
1 Jan 2013 Jahr
37.692
-0.424
-1.11%
1 Jan 2014 Jahr
39.739
+2.048
5.43%
Bewertung der Länder gemäß mit laufender Statistik nach Jahren


Kommentare: