29
/de/
de
AIzaSyAYiBZKx7MnpbEhh9jyipgxe19OcubqV5w
April 1, 2024
214123
Norway
NOR
true
2
1
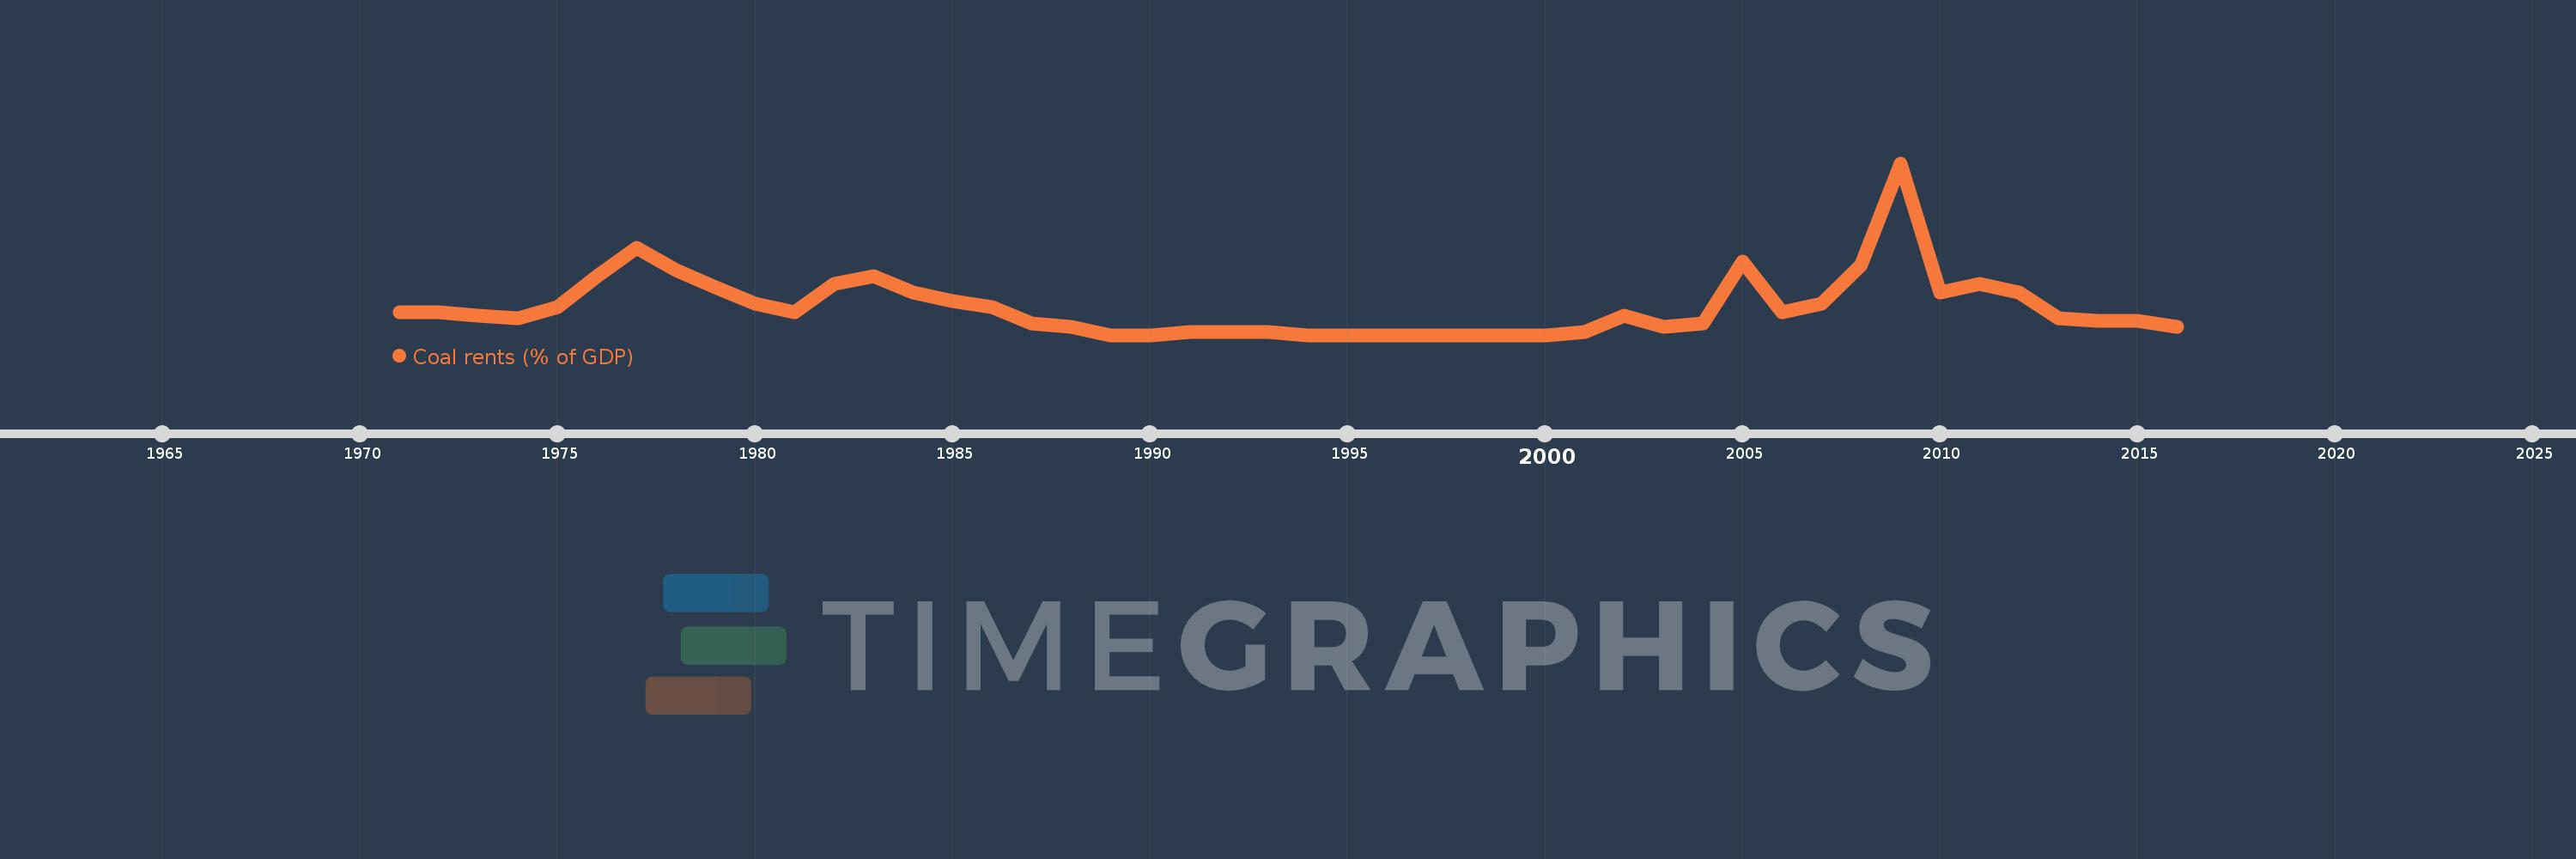
Coal rents (% of GDP)
2016,2015,2014,2013,2012,2011,2010,2009,2008,2007,2006,2005,2004,2003,2002,2001,2000,1999,1998,1997,1996,1995,1994,1993,1992,1991,1990,1989,1988,1987,1986,1985,1984,1983,1982,1981,1980,1979,1978,1977,1976,1975,1974,1973,1972,1971
Diese Statistik in anderen Ländern:
AfghanistanAlbaniaAlgeriaAngolaAntigua and BarbudaArab WorldArgentinaArmeniaArubaAustraliaAustriaAzerbaijanBahamas, TheBahrainBangladeshBarbadosBelarusBelgiumBelizeBeninBermudaBhutanBoliviaBosnia and HerzegovinaBotswanaBrazilBrunei DarussalamBulgariaBurkina FasoBurundiCabo VerdeCambodiaCameroonCanadaCaribbean small statesCayman IslandsCentral African RepublicCentral Europe and the BalticsChadChileChinaColombiaComorosCongo, Dem. Rep.Congo, Rep.Costa RicaCote d'IvoireCroatiaCubaCyprusCzech RepublicDenmarkDjiboutiDominicaDominican RepublicEarly-demographic dividendEast Asia & PacificEast Asia & Pacific (excluding high income)East Asia & Pacific (IDA & IBRD countries)EcuadorEgypt, Arab Rep.El SalvadorEquatorial GuineaEritreaEstoniaEthiopiaEuro areaEurope & Central AsiaEurope & Central Asia (excluding high income)Europe & Central Asia (IDA & IBRD countries)European UnionFijiFinlandFragile and conflict affected situationsFranceFrench PolynesiaGabonGambia, TheGeorgiaGermanyGhanaGreeceGreenlandGrenadaGuatemalaGuineaGuinea-BissauGuyanaHaitiHeavily indebted poor countries (HIPC)High incomeHondurasHong Kong SAR, ChinaHungaryIBRD onlyIcelandIDA & IBRD totalIDA blendIDA onlyIDA totalIndiaIndonesiaIran, Islamic Rep.IraqIrelandIsraelItalyJamaicaJapanJordanKazakhstanKenyaKiribatiKorea, Rep.KosovoKuwaitKyrgyz RepublicLao PDRLate-demographic dividendLatin America & Caribbean Latin America & Caribbean (excluding high income)Latin America & the Caribbean (IDA & IBRD countries)LatviaLeast developed countries: UN classificationLebanonLesothoLiberiaLibyaLithuaniaLow & middle incomeLow incomeLower middle incomeLuxembourgMacao SAR, ChinaMacedonia, FYRMadagascarMalawiMalaysiaMaldivesMaliMaltaMauritaniaMauritiusMexicoMiddle East & North AfricaMiddle East & North Africa (excluding high income)Middle East & North Africa (IDA & IBRD countries)Middle incomeMoldovaMongoliaMontenegroMoroccoMozambiqueMyanmarNamibiaNepalNetherlandsNew CaledoniaNew ZealandNicaraguaNigerNigeriaNorth AmericaNorwayOECD membersOmanOther small statesPacific island small statesPakistanPanamaPapua New GuineaParaguayPeruPhilippinesPolandPortugalPost-demographic dividendPre-demographic dividendPuerto RicoQatarRomaniaRussian FederationRwandaSamoaSao Tome and PrincipeSaudi ArabiaSenegalSerbiaSeychellesSierra LeoneSingaporeSlovak RepublicSloveniaSmall statesSolomon IslandsSouth AfricaSouth AsiaSouth Asia (IDA & IBRD)SpainSri LankaSt. Kitts and NevisSt. LuciaSt. Vincent and the GrenadinesSub-Saharan Africa Sub-Saharan Africa (excluding high income)Sub-Saharan Africa (IDA & IBRD countries)SudanSurinameSwazilandSwedenSwitzerlandSyrian Arab RepublicTajikistanTanzaniaThailandTimor-LesteTogoTongaTrinidad and TobagoTunisiaTurkeyTurkmenistanUgandaUkraineUnited Arab EmiratesUnited KingdomUnited StatesUpper middle incomeUruguayUzbekistanVanuatuVenezuela, RBVietnamVirgin Islands (U.S.)West Bank and GazaWorldYemen, Rep.ZambiaZimbabwe Zeitlinie:
Diese Zeitleiste vorliegt die Graphik ab 1971 J. bis 2016 J. Norway. Die Angaben bis 1970 J. sind nicht vorhanden. Die Zahl aktueller Beobachtungen nach Daten: 46.
Die Quelle (Bezeichnung):
Kennzahlen der Weltentwicklung
Die Quelle (Einrichtung):
Estimates based on sources and methods described in "The Changing Wealth of Nations: Measuring Sustainable Development in the New Millennium" (World Bank, 2011).
Kategorien:
Environment
Es wurde aktualisiert:
23 Apr 2017 Jahr
Kennzahlen der Wertänderungen vom Jahr zum Jahr
Minimum:
0.0
1 Jan 2000 Jahr
Maximum:
0.061
1 Jan 2009 Jahr
Zum Datum der Beobachtung
Wert
Absolute Veränderung
Die Veränderung bezüglich dem vorherigen Wert
1 Jan 1971 Jahr
0.008
+0.008
0.0%
1 Jan 1972 Jahr
0.008
+0.0
1.62%
1 Jan 1973 Jahr
0.007
-0.001
-15.44%
1 Jan 1974 Jahr
0.006
-0.001
-21.09%
1 Jan 1975 Jahr
0.01
+0.004
80.77%
1 Jan 1976 Jahr
0.021
+0.011
106.76%
1 Jan 1977 Jahr
0.031
+0.01
48.5%
1 Jan 1978 Jahr
0.023
-0.008
-25.06%
1 Jan 1979 Jahr
0.017
-0.006
-27.54%
1 Jan 1980 Jahr
0.011
-0.005
-31.99%
1 Jan 1981 Jahr
0.008
-0.003
-26.53%
1 Jan 1982 Jahr
0.018
+0.01
113.55%
1 Jan 1983 Jahr
0.021
+0.003
18.55%
1 Jan 1984 Jahr
0.015
-0.006
-28.57%
1 Jan 1985 Jahr
0.012
-0.004
-23.32%
1 Jan 1986 Jahr
0.01
-0.002
-18.12%
1 Jan 1987 Jahr
0.004
-0.005
-54.58%
1 Jan 1988 Jahr
0.003
-0.001
-34.28%
1 Jan 1989 Jahr
0.0
-0.003
-98.33%
1 Jan 1990 Jahr
0.0
+0.0
84.91%
1 Jan 1991 Jahr
0.001
+0.001
1.41 Tsnd.%
1 Jan 1992 Jahr
0.001
0.0
-4.18%
1 Jan 1993 Jahr
0.001
-0.001
-44.21%
1 Jan 1994 Jahr
0.0
-0.001
-87.9%
1 Jan 1995 Jahr
0.0
+0.0
29.79%
1 Jan 1996 Jahr
0.0
+0.0
304.27%
1 Jan 1997 Jahr
0.0
0.0
-55.03%
1 Jan 1998 Jahr
0.0
0.0
-20.87%
1 Jan 1999 Jahr
0.0
0.0
-16.41%
1 Jan 2000 Jahr
0.0
0.0
-92.12%
1 Jan 2001 Jahr
0.001
+0.001
6.07 Tsnd.%
1 Jan 2002 Jahr
0.007
+0.007
1.05 Tsnd.%
1 Jan 2003 Jahr
0.003
-0.005
-61.19%
1 Jan 2004 Jahr
0.004
+0.001
42.21%
1 Jan 2005 Jahr
0.026
+0.022
524.58%
1 Jan 2006 Jahr
0.008
-0.018
-69.58%
1 Jan 2007 Jahr
0.011
+0.003
44.18%
1 Jan 2008 Jahr
0.025
+0.014
120.99%
1 Jan 2009 Jahr
0.061
+0.036
142.17%
1 Jan 2010 Jahr
0.015
-0.045
-74.86%
1 Jan 2011 Jahr
0.018
+0.003
18.14%
1 Jan 2012 Jahr
0.015
-0.003
-15.12%
1 Jan 2013 Jahr
0.006
-0.009
-60.82%
1 Jan 2014 Jahr
0.005
-0.001
-24.39%
1 Jan 2015 Jahr
0.005
+0.0
1.85%
1 Jan 2016 Jahr
0.003
-0.001
-30.71%
Bewertung der Länder gemäß mit laufender Statistik nach Jahren


Kommentare: