29
/de/
de
AIzaSyAYiBZKx7MnpbEhh9jyipgxe19OcubqV5w
April 1, 2024
206754
Nepal
NPL
true
2
1
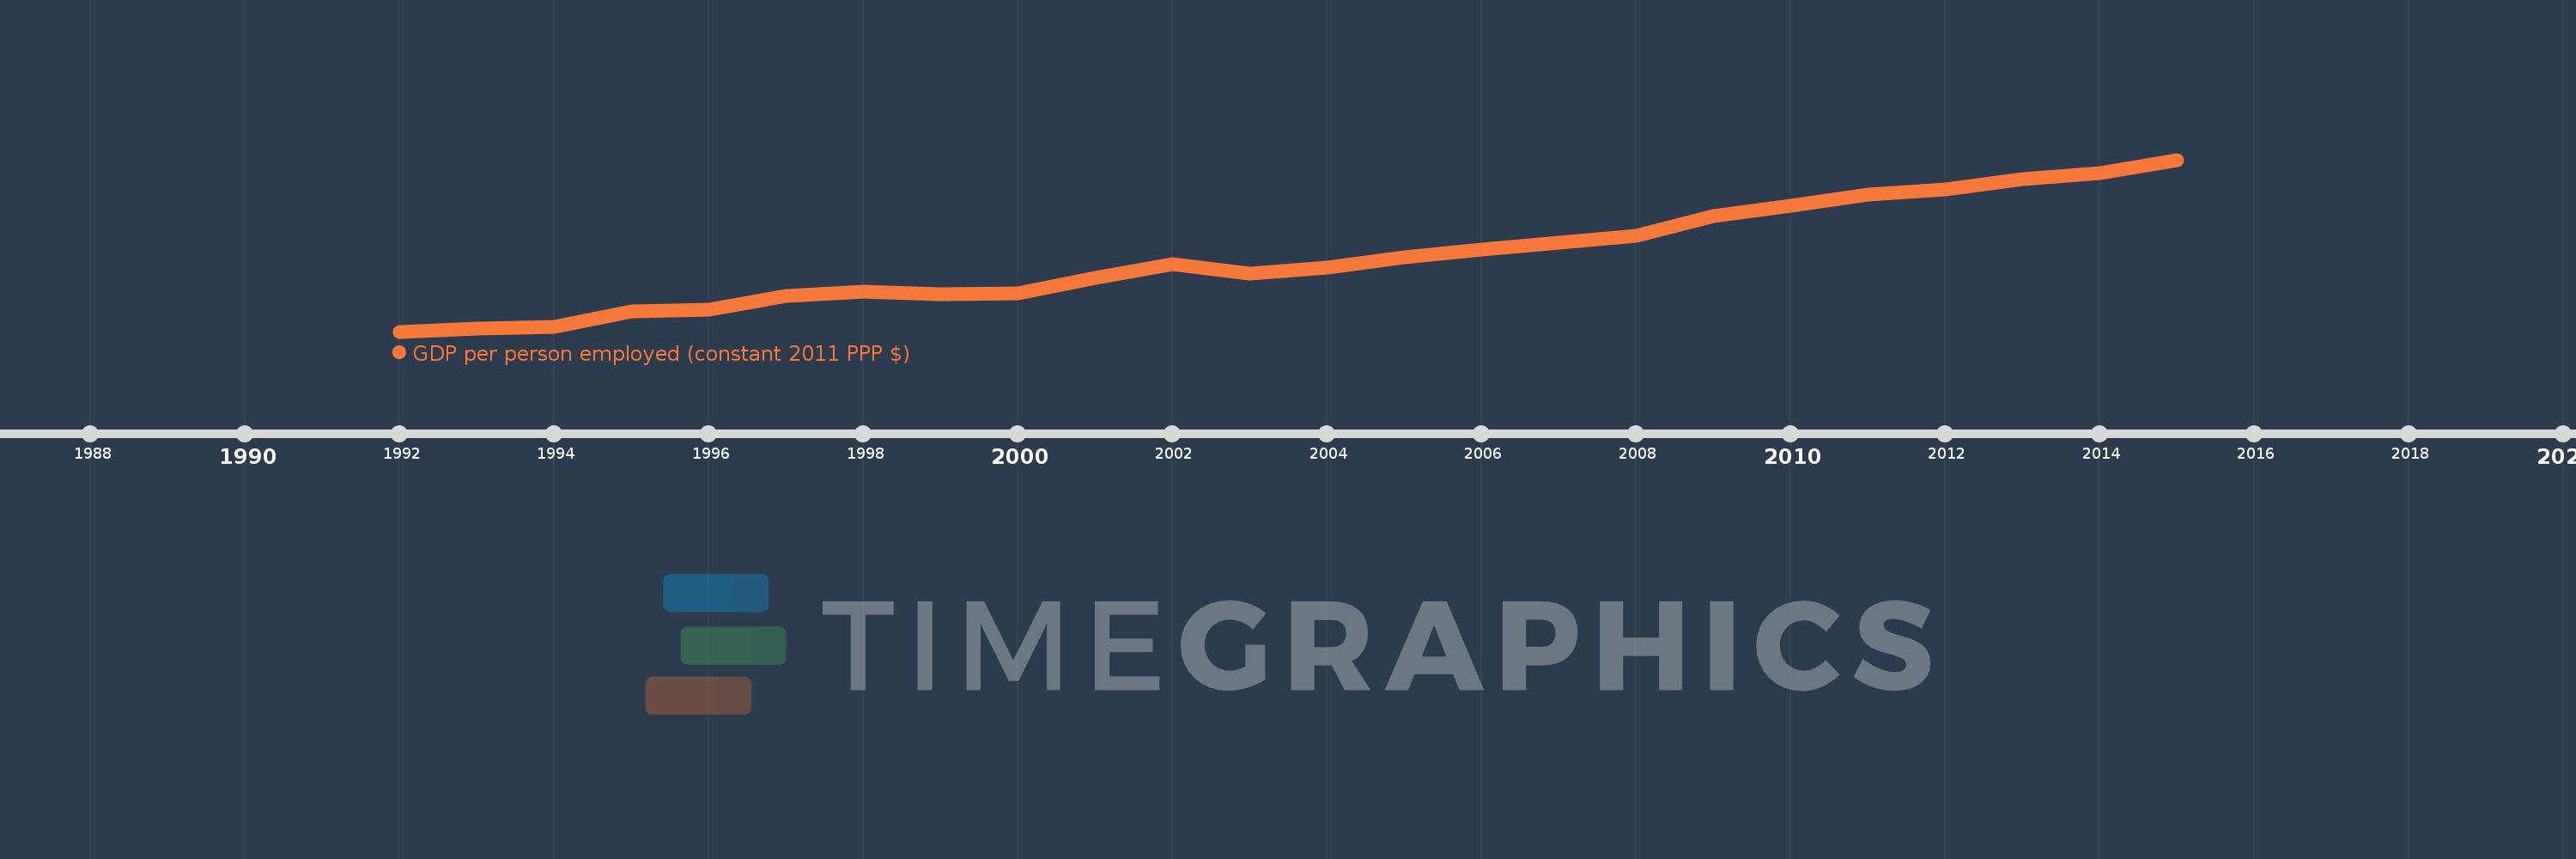
GDP per person employed (constant 2011 PPP $)
2015,2014,2013,2012,2011,2010,2009,2008,2007,2006,2005,2004,2003,2002,2001,2000,1999,1998,1997,1996,1995,1994,1993,1992
Diese Statistik in anderen Ländern:
AfghanistanAlbaniaAlgeriaAngolaArab WorldArgentinaArmeniaAustraliaAustriaAzerbaijanBahamas, TheBahrainBangladeshBarbadosBelarusBelgiumBelizeBeninBhutanBoliviaBosnia and HerzegovinaBotswanaBrazilBrunei DarussalamBulgariaBurkina FasoBurundiCabo VerdeCambodiaCameroonCanadaCaribbean small statesCentral African RepublicCentral Europe and the BalticsChadChileChinaColombiaComorosCongo, Dem. Rep.Congo, Rep.Costa RicaCote d'IvoireCroatiaCubaCyprusCzech RepublicDenmarkDominican RepublicEarly-demographic dividendEast Asia & PacificEast Asia & Pacific (excluding high income)East Asia & Pacific (IDA & IBRD countries)EcuadorEgypt, Arab Rep.El SalvadorEquatorial GuineaEritreaEstoniaEthiopiaEuro areaEurope & Central AsiaEurope & Central Asia (excluding high income)Europe & Central Asia (IDA & IBRD countries)European UnionFijiFinlandFragile and conflict affected situationsFranceGabonGambia, TheGeorgiaGermanyGhanaGreeceGuatemalaGuineaGuinea-BissauGuyanaHaitiHeavily indebted poor countries (HIPC)High incomeHondurasHong Kong SAR, ChinaHungaryIBRD onlyIcelandIDA & IBRD totalIDA blendIDA onlyIDA totalIndiaIndonesiaIran, Islamic Rep.IraqIrelandIsraelItalyJamaicaJapanJordanKazakhstanKenyaKorea, Dem. People’s Rep.Korea, Rep.KuwaitKyrgyz RepublicLao PDRLate-demographic dividendLatin America & Caribbean Latin America & Caribbean (excluding high income)Latin America & the Caribbean (IDA & IBRD countries)LatviaLeast developed countries: UN classificationLebanonLesothoLiberiaLibyaLithuaniaLow & middle incomeLow incomeLower middle incomeLuxembourgMacao SAR, ChinaMacedonia, FYRMadagascarMalawiMalaysiaMaldivesMaliMaltaMauritaniaMauritiusMexicoMiddle East & North AfricaMiddle East & North Africa (excluding high income)Middle East & North Africa (IDA & IBRD countries)Middle incomeMoldovaMongoliaMontenegroMoroccoMozambiqueMyanmarNamibiaNepalNetherlandsNew ZealandNicaraguaNigerNigeriaNorth AmericaNorwayOECD membersOmanOther small statesPakistanPanamaPapua New GuineaParaguayPeruPhilippinesPolandPortugalPost-demographic dividendPre-demographic dividendPuerto RicoQatarRomaniaRussian FederationRwandaSaudi ArabiaSenegalSerbiaSierra LeoneSingaporeSlovak RepublicSloveniaSmall statesSolomon IslandsSomaliaSouth AfricaSouth AsiaSouth Asia (IDA & IBRD)SpainSri LankaSub-Saharan Africa Sub-Saharan Africa (excluding high income)Sub-Saharan Africa (IDA & IBRD countries)SudanSurinameSwazilandSwedenSwitzerlandSyrian Arab RepublicTajikistanTanzaniaThailandTimor-LesteTogoTrinidad and TobagoTunisiaTurkeyTurkmenistanUgandaUkraineUnited Arab EmiratesUnited KingdomUnited StatesUpper middle incomeUruguayUzbekistanVenezuela, RBVietnamWest Bank and GazaWorldYemen, Rep.ZambiaZimbabwe Zeitlinie:
Diese Zeitleiste vorliegt die Graphik ab 1992 J. bis 2015 J. Nepal. Die Angaben bis 1991 J. sind nicht vorhanden. Die Zahl aktueller Beobachtungen nach Daten: 24.
Die Quelle (Bezeichnung):
Kennzahlen der Weltentwicklung
Die Quelle (Einrichtung):
International Labour Organization, Key Indicators of the Labour Market database.
Kategorien:
Social Protection & Labor
Es wurde aktualisiert:
23 Apr 2017 Jahr
Kennzahlen der Wertänderungen vom Jahr zum Jahr
im Durchschnitt:
3.344 Tsnd.
Minimum:
2.668 Tsnd.
1 Jan 1992 Jahr
Maximum:
4.229 Tsnd.
1 Jan 2015 Jahr
Zum Datum der Beobachtung
Wert
Absolute Veränderung
Die Veränderung bezüglich dem vorherigen Wert
1 Jan 1992 Jahr
2.668 Tsnd.
+2.668 Tsnd.
0.0%
1 Jan 1993 Jahr
2.692 Tsnd.
+24.18
0.91%
1 Jan 1994 Jahr
2.714 Tsnd.
+21.98
0.82%
1 Jan 1995 Jahr
2.85 Tsnd.
+136.13
5.02%
1 Jan 1996 Jahr
2.864 Tsnd.
+13.31
0.47%
1 Jan 1997 Jahr
2.99 Tsnd.
+126.52
4.42%
1 Jan 1998 Jahr
3.027 Tsnd.
+37.44
1.25%
1 Jan 1999 Jahr
3.009 Tsnd.
-18.56
-0.61%
1 Jan 2000 Jahr
3.015 Tsnd.
+6.18
0.21%
1 Jan 2001 Jahr
3.155 Tsnd.
+139.68
4.63%
1 Jan 2002 Jahr
3.281 Tsnd.
+126.22
4.0%
1 Jan 2003 Jahr
3.198 Tsnd.
-83.41
-2.54%
1 Jan 2004 Jahr
3.246 Tsnd.
+47.95
1.5%
1 Jan 2005 Jahr
3.342 Tsnd.
+96.2
2.96%
1 Jan 2006 Jahr
3.413 Tsnd.
+70.91
2.12%
1 Jan 2007 Jahr
3.476 Tsnd.
+63.18
1.85%
1 Jan 2008 Jahr
3.54 Tsnd.
+64.01
1.84%
1 Jan 2009 Jahr
3.714 Tsnd.
+174.23
4.92%
1 Jan 2010 Jahr
3.81 Tsnd.
+95.56
2.57%
1 Jan 2011 Jahr
3.912 Tsnd.
+102.0
2.68%
1 Jan 2012 Jahr
3.958 Tsnd.
+46.72
1.19%
1 Jan 2013 Jahr
4.054 Tsnd.
+96.08
2.43%
1 Jan 2014 Jahr
4.108 Tsnd.
+53.45
1.32%
1 Jan 2015 Jahr
4.229 Tsnd.
+120.84
2.94%
Bewertung der Länder gemäß mit laufender Statistik nach Jahren


Kommentare: