29
/de/
de
AIzaSyAYiBZKx7MnpbEhh9jyipgxe19OcubqV5w
April 1, 2024
205836
Namibia
NAM
true
2
1
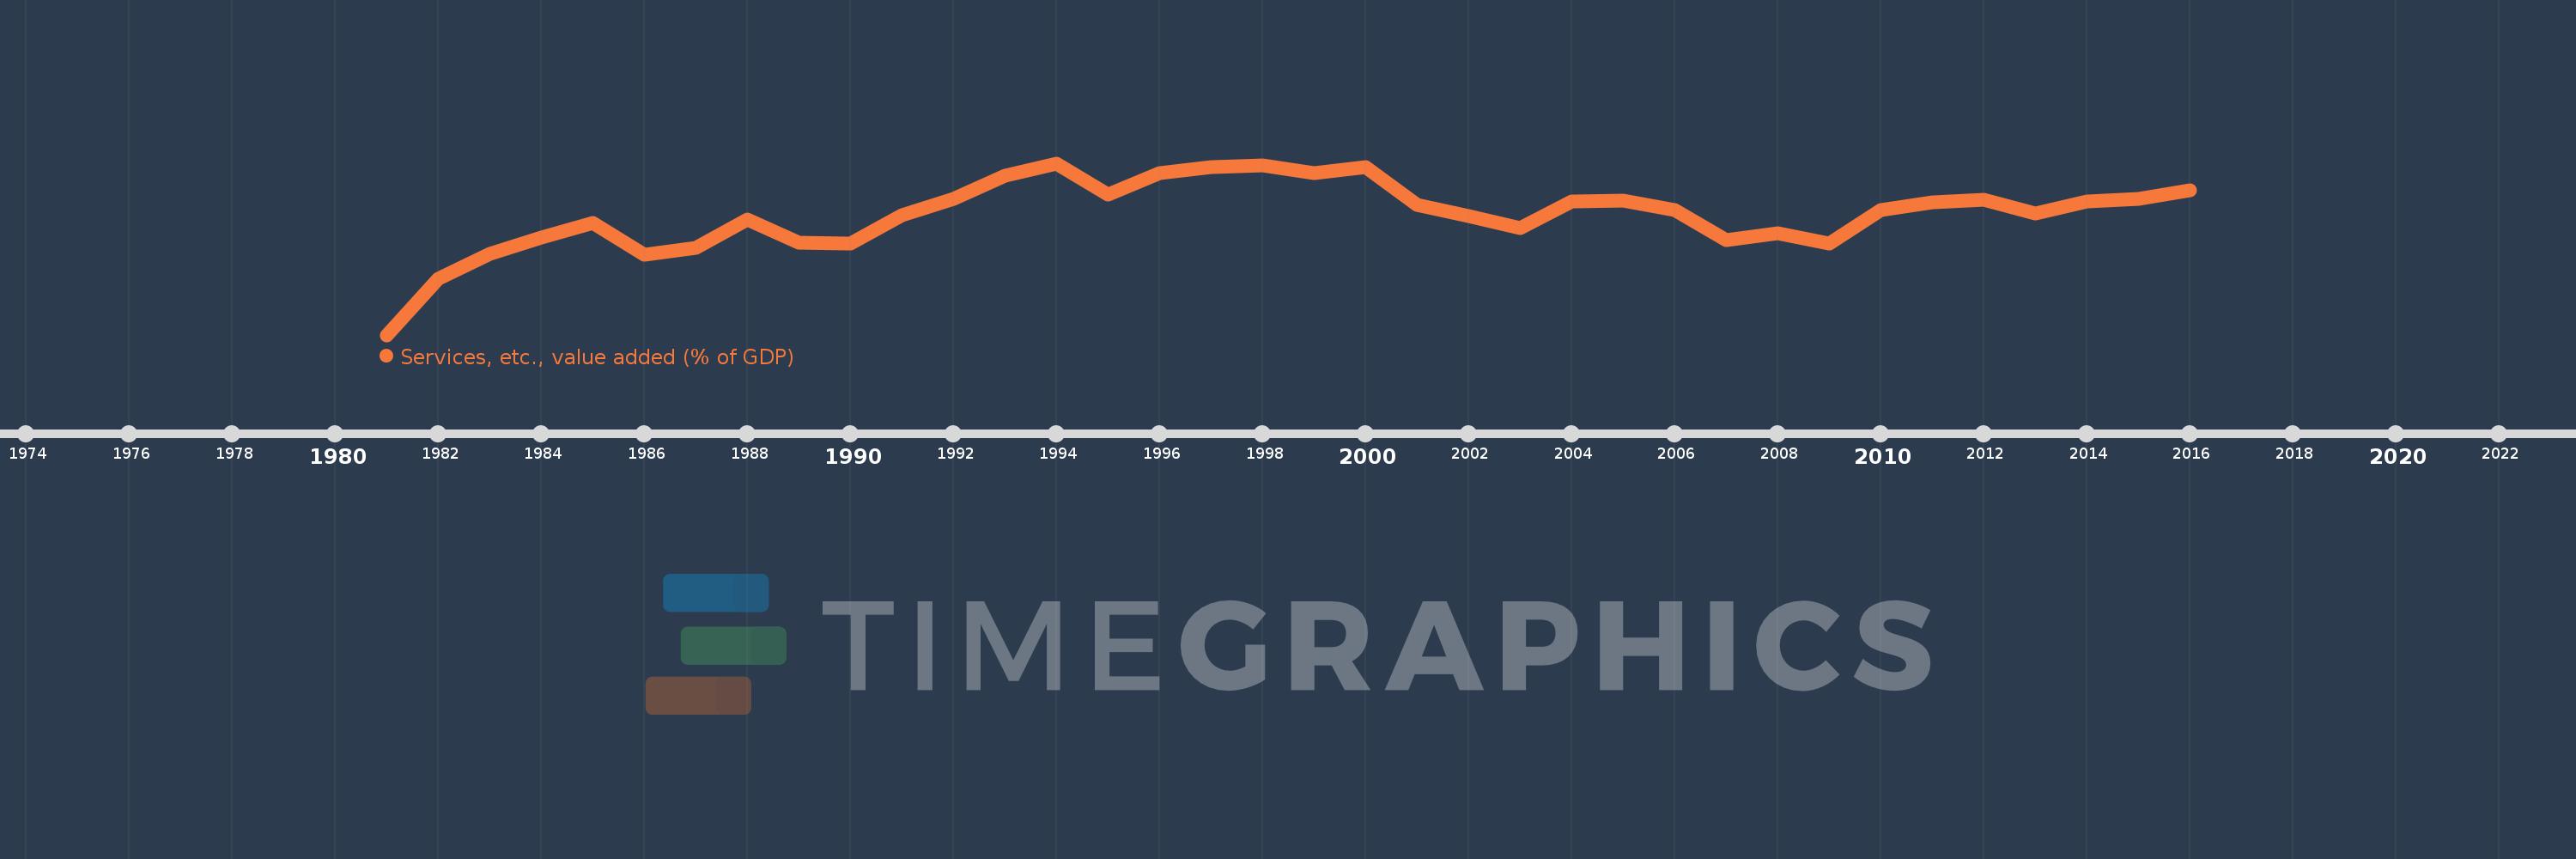
Services, etc., value added (% of GDP)
2016,2015,2014,2013,2012,2011,2010,2009,2008,2007,2006,2005,2004,2003,2002,2001,2000,1999,1998,1997,1996,1995,1994,1993,1992,1991,1990,1989,1988,1987,1986,1985,1984,1983,1982,1981
Diese Statistik in anderen Ländern:
AfghanistanAlbaniaAlgeriaAndorraAngolaAntigua and BarbudaArab WorldArgentinaArmeniaArubaAustraliaAustriaAzerbaijanBahamas, TheBahrainBangladeshBarbadosBelarusBelgiumBelizeBeninBermudaBhutanBoliviaBosnia and HerzegovinaBotswanaBrazilBrunei DarussalamBulgariaBurkina FasoBurundiCabo VerdeCambodiaCameroonCanadaCaribbean small statesCentral African RepublicCentral Europe and the BalticsChadChileChinaColombiaComorosCongo, Dem. Rep.Congo, Rep.Costa RicaCote d'IvoireCroatiaCubaCyprusCzech RepublicDenmarkDjiboutiDominicaDominican RepublicEarly-demographic dividendEast Asia & PacificEast Asia & Pacific (excluding high income)East Asia & Pacific (IDA & IBRD countries)EcuadorEgypt, Arab Rep.El SalvadorEquatorial GuineaEritreaEstoniaEthiopiaEuro areaEurope & Central AsiaEurope & Central Asia (excluding high income)Europe & Central Asia (IDA & IBRD countries)European UnionFaroe IslandsFijiFinlandFragile and conflict affected situationsFranceGabonGambia, TheGeorgiaGermanyGhanaGreeceGrenadaGuatemalaGuineaGuinea-BissauGuyanaHeavily indebted poor countries (HIPC)High incomeHondurasHong Kong SAR, ChinaHungaryIBRD onlyIcelandIDA & IBRD totalIDA blendIDA onlyIDA totalIndiaIndonesiaIran, Islamic Rep.IrelandItalyJamaicaJapanJordanKazakhstanKenyaKiribatiKorea, Rep.KosovoKuwaitKyrgyz RepublicLao PDRLate-demographic dividendLatin America & Caribbean Latin America & Caribbean (excluding high income)Latin America & the Caribbean (IDA & IBRD countries)LatviaLeast developed countries: UN classificationLebanonLesothoLibyaLithuaniaLow & middle incomeLow incomeLower middle incomeLuxembourgMacao SAR, ChinaMacedonia, FYRMadagascarMalawiMalaysiaMaldivesMaliMaltaMarshall IslandsMauritaniaMauritiusMexicoMicronesia, Fed. Sts.Middle East & North AfricaMiddle East & North Africa (excluding high income)Middle East & North Africa (IDA & IBRD countries)Middle incomeMoldovaMongoliaMontenegroMoroccoMozambiqueMyanmarNamibiaNepalNetherlandsNew CaledoniaNew ZealandNicaraguaNigerNigeriaNorth AmericaNorwayOECD membersOmanOther small statesPacific island small statesPakistanPalauPanamaPapua New GuineaParaguayPeruPhilippinesPolandPortugalPost-demographic dividendPre-demographic dividendPuerto RicoQatarRomaniaRussian FederationRwandaSao Tome and PrincipeSaudi ArabiaSenegalSerbiaSeychellesSierra LeoneSingaporeSlovak RepublicSloveniaSmall statesSolomon IslandsSomaliaSouth AfricaSouth AsiaSouth Asia (IDA & IBRD)SpainSri LankaSt. Kitts and NevisSt. LuciaSt. Vincent and the GrenadinesSub-Saharan Africa Sub-Saharan Africa (excluding high income)Sub-Saharan Africa (IDA & IBRD countries)SudanSurinameSwazilandSwedenSwitzerlandSyrian Arab RepublicTajikistanTanzaniaThailandTimor-LesteTogoTongaTrinidad and TobagoTunisiaTurkeyTurkmenistanTuvaluUgandaUkraineUnited KingdomUnited StatesUpper middle incomeUruguayUzbekistanVanuatuVenezuela, RBVietnamWest Bank and GazaWorldYemen, Rep.ZambiaZimbabwe Zeitlinie:
Diese Zeitleiste vorliegt die Graphik ab 1981 J. bis 2016 J. Namibia. Die Angaben bis 1980 J. sind nicht vorhanden. Die Zahl aktueller Beobachtungen nach Daten: 36.
Die Quelle (Bezeichnung):
Kennzahlen der Weltentwicklung
Die Quelle (Einrichtung):
World Bank national accounts data, and OECD National Accounts data files.
Kategorien:
Economy & Growth
Es wurde aktualisiert:
23 Apr 2017 Jahr
Kennzahlen der Wertänderungen vom Jahr zum Jahr
Minimum:
40.693
1 Jan 1981 Jahr
Maximum:
66.45
1 Jan 1994 Jahr
Zum Datum der Beobachtung
Wert
Absolute Veränderung
Die Veränderung bezüglich dem vorherigen Wert
1 Jan 1981 Jahr
40.693
+40.693
0.0%
1 Jan 1982 Jahr
49.105
+8.412
20.67%
1 Jan 1983 Jahr
52.893
+3.788
7.71%
1 Jan 1984 Jahr
55.347
+2.455
4.64%
1 Jan 1985 Jahr
57.495
+2.147
3.88%
1 Jan 1986 Jahr
52.743
-4.751
-8.26%
1 Jan 1987 Jahr
53.815
+1.072
2.03%
1 Jan 1988 Jahr
57.953
+4.138
7.69%
1 Jan 1989 Jahr
54.484
-3.469
-5.99%
1 Jan 1990 Jahr
54.348
-0.136
-0.25%
1 Jan 1991 Jahr
58.69
+4.342
7.99%
1 Jan 1992 Jahr
61.155
+2.464
4.2%
1 Jan 1993 Jahr
64.636
+3.481
5.69%
1 Jan 1994 Jahr
66.45
+1.815
2.81%
1 Jan 1995 Jahr
61.795
-4.655
-7.01%
1 Jan 1996 Jahr
64.945
+3.149
5.1%
1 Jan 1997 Jahr
65.906
+0.961
1.48%
1 Jan 1998 Jahr
66.073
+0.168
0.25%
1 Jan 1999 Jahr
64.981
-1.093
-1.65%
1 Jan 2000 Jahr
65.906
+0.925
1.42%
1 Jan 2001 Jahr
60.217
-5.689
-8.63%
1 Jan 2002 Jahr
58.567
-1.649
-2.74%
1 Jan 2003 Jahr
56.744
-1.824
-3.11%
1 Jan 2004 Jahr
60.714
+3.97
7.0%
1 Jan 2005 Jahr
60.841
+0.127
0.21%
1 Jan 2006 Jahr
59.495
-1.345
-2.21%
1 Jan 2007 Jahr
54.891
-4.605
-7.74%
1 Jan 2008 Jahr
56.01
+1.119
2.04%
1 Jan 2009 Jahr
54.391
-1.619
-2.89%
1 Jan 2010 Jahr
59.431
+5.04
9.27%
1 Jan 2011 Jahr
60.542
+1.111
1.87%
1 Jan 2012 Jahr
61.015
+0.473
0.78%
1 Jan 2013 Jahr
58.93
-2.085
-3.42%
1 Jan 2014 Jahr
60.662
+1.732
2.94%
1 Jan 2015 Jahr
61.081
+0.419
0.69%
1 Jan 2016 Jahr
62.343
+1.263
2.07%
Bewertung der Länder gemäß mit laufender Statistik nach Jahren


Kommentare: