29
/de/
de
AIzaSyAYiBZKx7MnpbEhh9jyipgxe19OcubqV5w
April 1, 2024
195910
Mexico
MEX
true
2
1
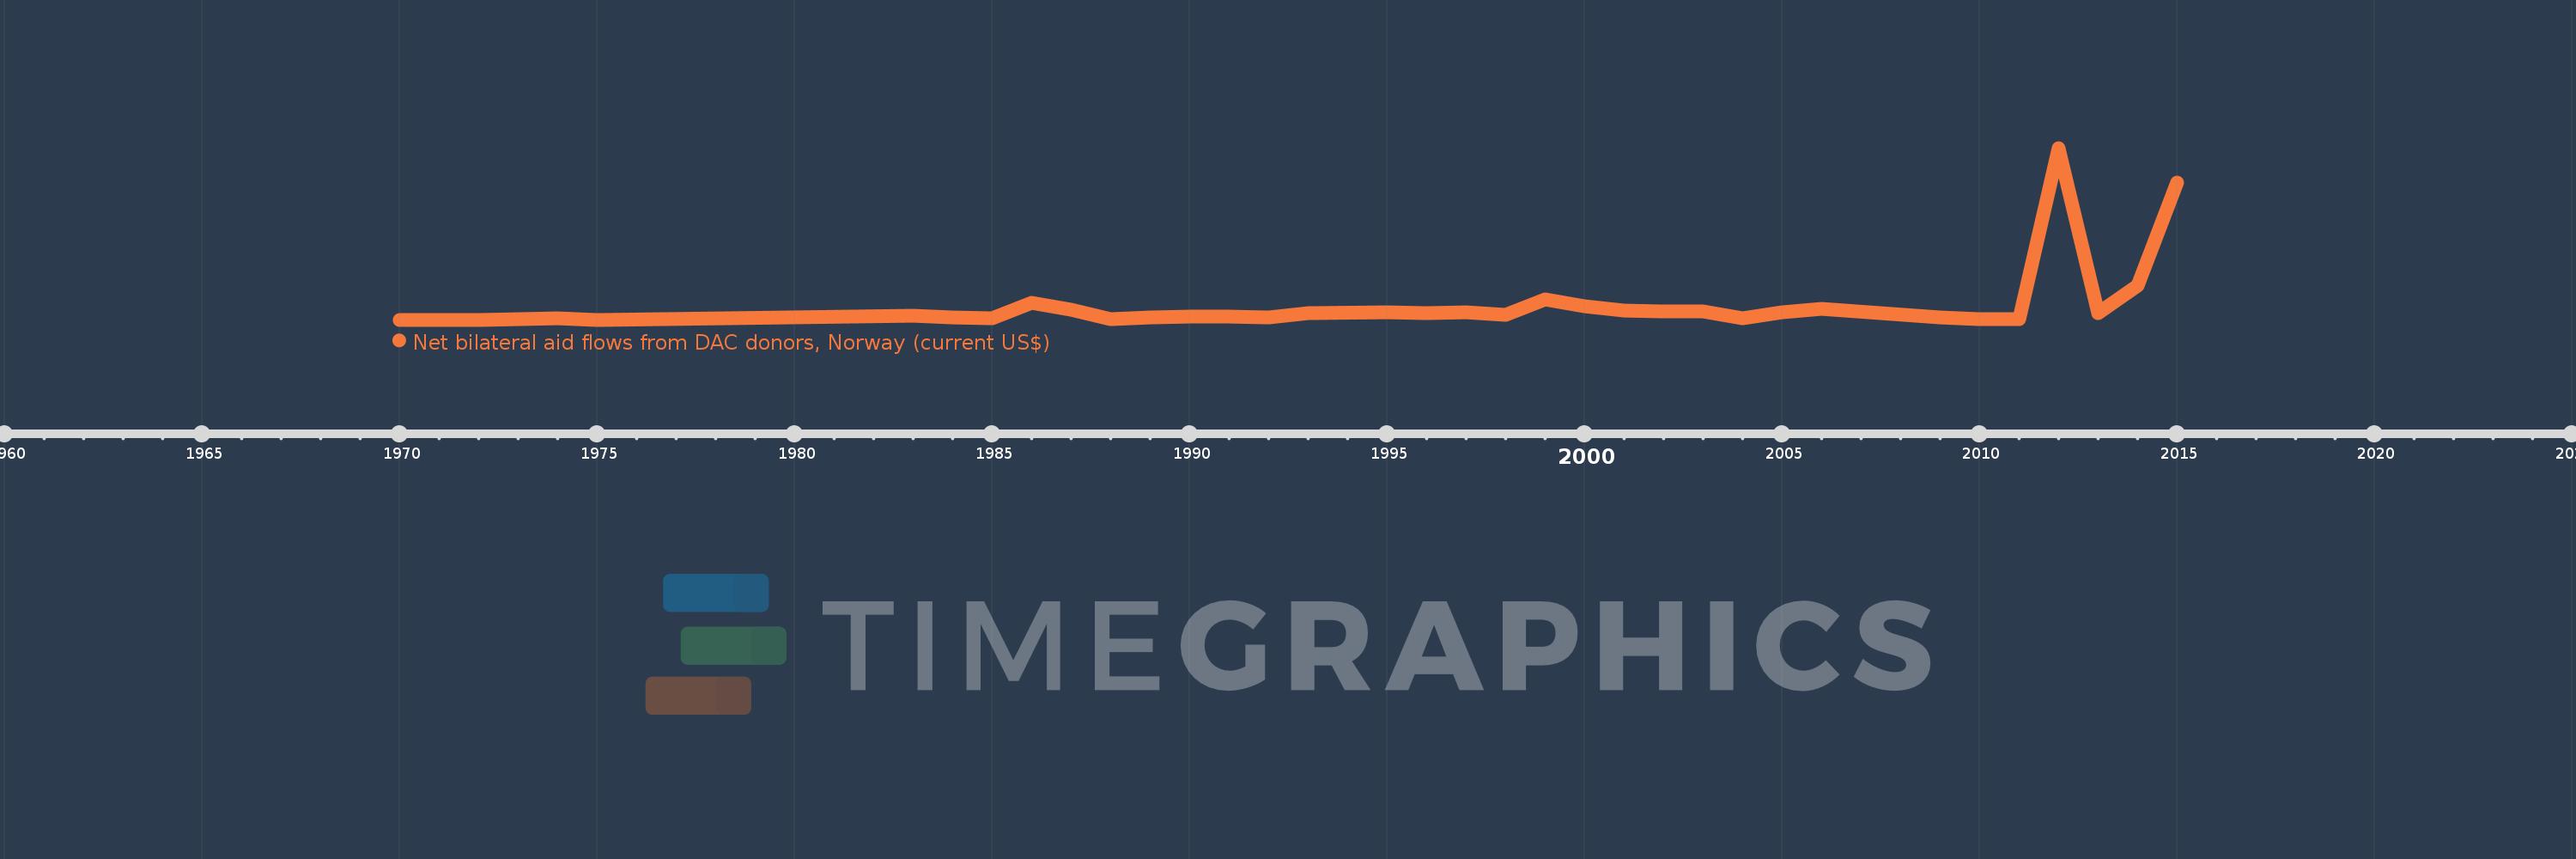
Net bilateral aid flows from DAC donors, Norway (current US$)
2015,2014,2013,2012,2011,2010,2009,2006,2005,2004,2003,2002,2001,2000,1999,1998,1997,1996,1995,1993,1992,1991,1990,1989,1988,1987,1986,1985,1984,1983,1975,1974,1973,1972,1971,1970
Diese Statistik in anderen Ländern:
AfghanistanAlbaniaAlgeriaAngolaAntigua and BarbudaArab WorldArgentinaArmeniaAzerbaijanBahrainBangladeshBarbadosBelarusBelizeBeninBermudaBhutanBoliviaBosnia and HerzegovinaBotswanaBrazilBulgariaBurkina FasoBurundiCabo VerdeCambodiaCameroonCaribbean small statesCentral African RepublicCentral Europe and the BalticsChadChileChinaColombiaComorosCongo, Dem. Rep.Congo, Rep.Costa RicaCote d'IvoireCroatiaCubaCyprusCzech RepublicDjiboutiDominican RepublicEast Asia & PacificEast Asia & Pacific (excluding high income)East Asia & Pacific (IDA & IBRD countries)EcuadorEgypt, Arab Rep.El SalvadorEquatorial GuineaEritreaEstoniaEthiopiaEuro areaEurope & Central AsiaEurope & Central Asia (excluding high income)Europe & Central Asia (IDA & IBRD countries)European UnionFijiFragile and conflict affected situationsGabonGambia, TheGeorgiaGhanaGibraltarGrenadaGuatemalaGuineaGuinea-BissauGuyanaHaitiHeavily indebted poor countries (HIPC)High incomeHondurasHong Kong SAR, ChinaHungaryIBRD onlyIDA & IBRD totalIDA blendIDA onlyIDA totalIndiaIndonesiaIran, Islamic Rep.IraqIsraelJamaicaJordanKazakhstanKenyaKiribatiKorea, Dem. People’s Rep.Korea, Rep.KosovoKuwaitKyrgyz RepublicLao PDRLatin America & Caribbean Latin America & Caribbean (excluding high income)Latin America & the Caribbean (IDA & IBRD countries)LatviaLeast developed countries: UN classificationLebanonLesothoLiberiaLibyaLithuaniaLow & middle incomeLow incomeLower middle incomeMacao SAR, ChinaMacedonia, FYRMadagascarMalawiMalaysiaMaldivesMaliMaltaMarshall IslandsMauritaniaMauritiusMexicoMiddle East & North AfricaMiddle East & North Africa (excluding high income)Middle East & North Africa (IDA & IBRD countries)Middle incomeMoldovaMongoliaMontenegroMoroccoMozambiqueMyanmarNamibiaNauruNepalNicaraguaNigerNigeriaNorth AmericaOECD membersOmanOther small statesPacific island small statesPakistanPanamaPapua New GuineaParaguayPeruPhilippinesPolandRomaniaRussian FederationRwandaSamoaSao Tome and PrincipeSaudi ArabiaSenegalSerbiaSeychellesSierra LeoneSingaporeSlovak RepublicSloveniaSmall statesSolomon IslandsSomaliaSouth AfricaSouth AsiaSouth Asia (IDA & IBRD)South SudanSri LankaSt. Kitts and NevisSt. LuciaSt. Vincent and the GrenadinesSub-Saharan Africa Sub-Saharan Africa (excluding high income)Sub-Saharan Africa (IDA & IBRD countries)SudanSurinameSwazilandSyrian Arab RepublicTajikistanTanzaniaThailandTimor-LesteTogoTongaTrinidad and TobagoTunisiaTurkeyTurkmenistanUgandaUkraineUnited Arab EmiratesUpper middle incomeUruguayUzbekistanVanuatuVenezuela, RBVietnamWest Bank and GazaWorldYemen, Rep.ZambiaZimbabwe Zeitlinie:
Diese Zeitleiste vorliegt die Graphik ab 1970 J. bis 2015 J. Mexico. Die Angaben bis 1969 J. sind nicht vorhanden. Die Zahl aktueller Beobachtungen nach Daten: 36.
Die Quelle (Bezeichnung):
Kennzahlen der Weltentwicklung
Die Quelle (Einrichtung):
Development Assistance Committee of the Organisation for Economic Co-operation and Development, Geographical Distribution of Financial Flows to Developing Countries, Development Co-operation Report, and International Development Statistics database. Data are available online at: www.oecd.org/dac/stats/idsonline.
Kategorien:
Aid Effectiveness
Es wurde aktualisiert:
23 Apr 2017 Jahr
Kennzahlen der Wertänderungen vom Jahr zum Jahr
im Durchschnitt:
688.056 Tsnd.
Minimum:
10.0 Tsnd.
1 Jan 1970 Jahr
Maximum:
8.19 Mln.
1 Jan 2012 Jahr
Zum Datum der Beobachtung
Wert
Absolute Veränderung
Die Veränderung bezüglich dem vorherigen Wert
1 Jan 1970 Jahr
10.0 Tsnd.
+10.0 Tsnd.
0.0%
1 Jan 1971 Jahr
10.0 Tsnd.
0.0
0.0%
1 Jan 1972 Jahr
10.0 Tsnd.
0.0
0.0%
1 Jan 1973 Jahr
40.0 Tsnd.
+30.0 Tsnd.
300.0%
1 Jan 1974 Jahr
60.0 Tsnd.
+20.0 Tsnd.
50.0%
1 Jan 1975 Jahr
10.0 Tsnd.
-50.0 Tsnd.
-83.33%
1 Jan 1983 Jahr
210.0 Tsnd.
+200.0 Tsnd.
2.0 Tsnd.%
1 Jan 1984 Jahr
110.0 Tsnd.
-100.0 Tsnd.
-47.62%
1 Jan 1985 Jahr
80.0 Tsnd.
-30.0 Tsnd.
-27.27%
1 Jan 1986 Jahr
810.0 Tsnd.
+730.0 Tsnd.
912.5%
1 Jan 1987 Jahr
500.0 Tsnd.
-310.0 Tsnd.
-38.27%
1 Jan 1988 Jahr
30.0 Tsnd.
-470.0 Tsnd.
-94.0%
1 Jan 1989 Jahr
120.0 Tsnd.
+90.0 Tsnd.
300.0%
1 Jan 1990 Jahr
170.0 Tsnd.
+50.0 Tsnd.
41.67%
1 Jan 1991 Jahr
170.0 Tsnd.
0.0
0.0%
1 Jan 1992 Jahr
110.0 Tsnd.
-60.0 Tsnd.
-35.29%
1 Jan 1993 Jahr
320.0 Tsnd.
+210.0 Tsnd.
190.91%
1 Jan 1995 Jahr
350.0 Tsnd.
+30.0 Tsnd.
9.38%
1 Jan 1996 Jahr
340.0 Tsnd.
-10.0 Tsnd.
-2.86%
1 Jan 1997 Jahr
380.0 Tsnd.
+40.0 Tsnd.
11.76%
1 Jan 1998 Jahr
240.0 Tsnd.
-140.0 Tsnd.
-36.84%
1 Jan 1999 Jahr
970.0 Tsnd.
+730.0 Tsnd.
304.17%
1 Jan 2000 Jahr
640.0 Tsnd.
-330.0 Tsnd.
-34.02%
1 Jan 2001 Jahr
440.0 Tsnd.
-200.0 Tsnd.
-31.25%
1 Jan 2002 Jahr
400.0 Tsnd.
-40.0 Tsnd.
-9.09%
1 Jan 2003 Jahr
390.0 Tsnd.
-10.0 Tsnd.
-2.5%
1 Jan 2004 Jahr
90.0 Tsnd.
-300.0 Tsnd.
-76.92%
1 Jan 2005 Jahr
360.0 Tsnd.
+270.0 Tsnd.
300.0%
1 Jan 2006 Jahr
530.0 Tsnd.
+170.0 Tsnd.
47.22%
1 Jan 2009 Jahr
120.0 Tsnd.
-410.0 Tsnd.
-77.36%
1 Jan 2010 Jahr
20.0 Tsnd.
-100.0 Tsnd.
-83.33%
1 Jan 2011 Jahr
50.0 Tsnd.
+30.0 Tsnd.
150.0%
1 Jan 2012 Jahr
8.19 Mln.
+8.14 Mln.
16.28 Tsnd.%
1 Jan 2013 Jahr
330.0 Tsnd.
-7.86 Mln.
-95.97%
1 Jan 2014 Jahr
1.62 Mln.
+1.29 Mln.
390.91%
1 Jan 2015 Jahr
6.54 Mln.
+4.92 Mln.
303.7%
Bewertung der Länder gemäß mit laufender Statistik nach Jahren


Kommentare: