29
/de/
de
AIzaSyAYiBZKx7MnpbEhh9jyipgxe19OcubqV5w
April 1, 2024
193078
Mauritania
MRT
true
2
1
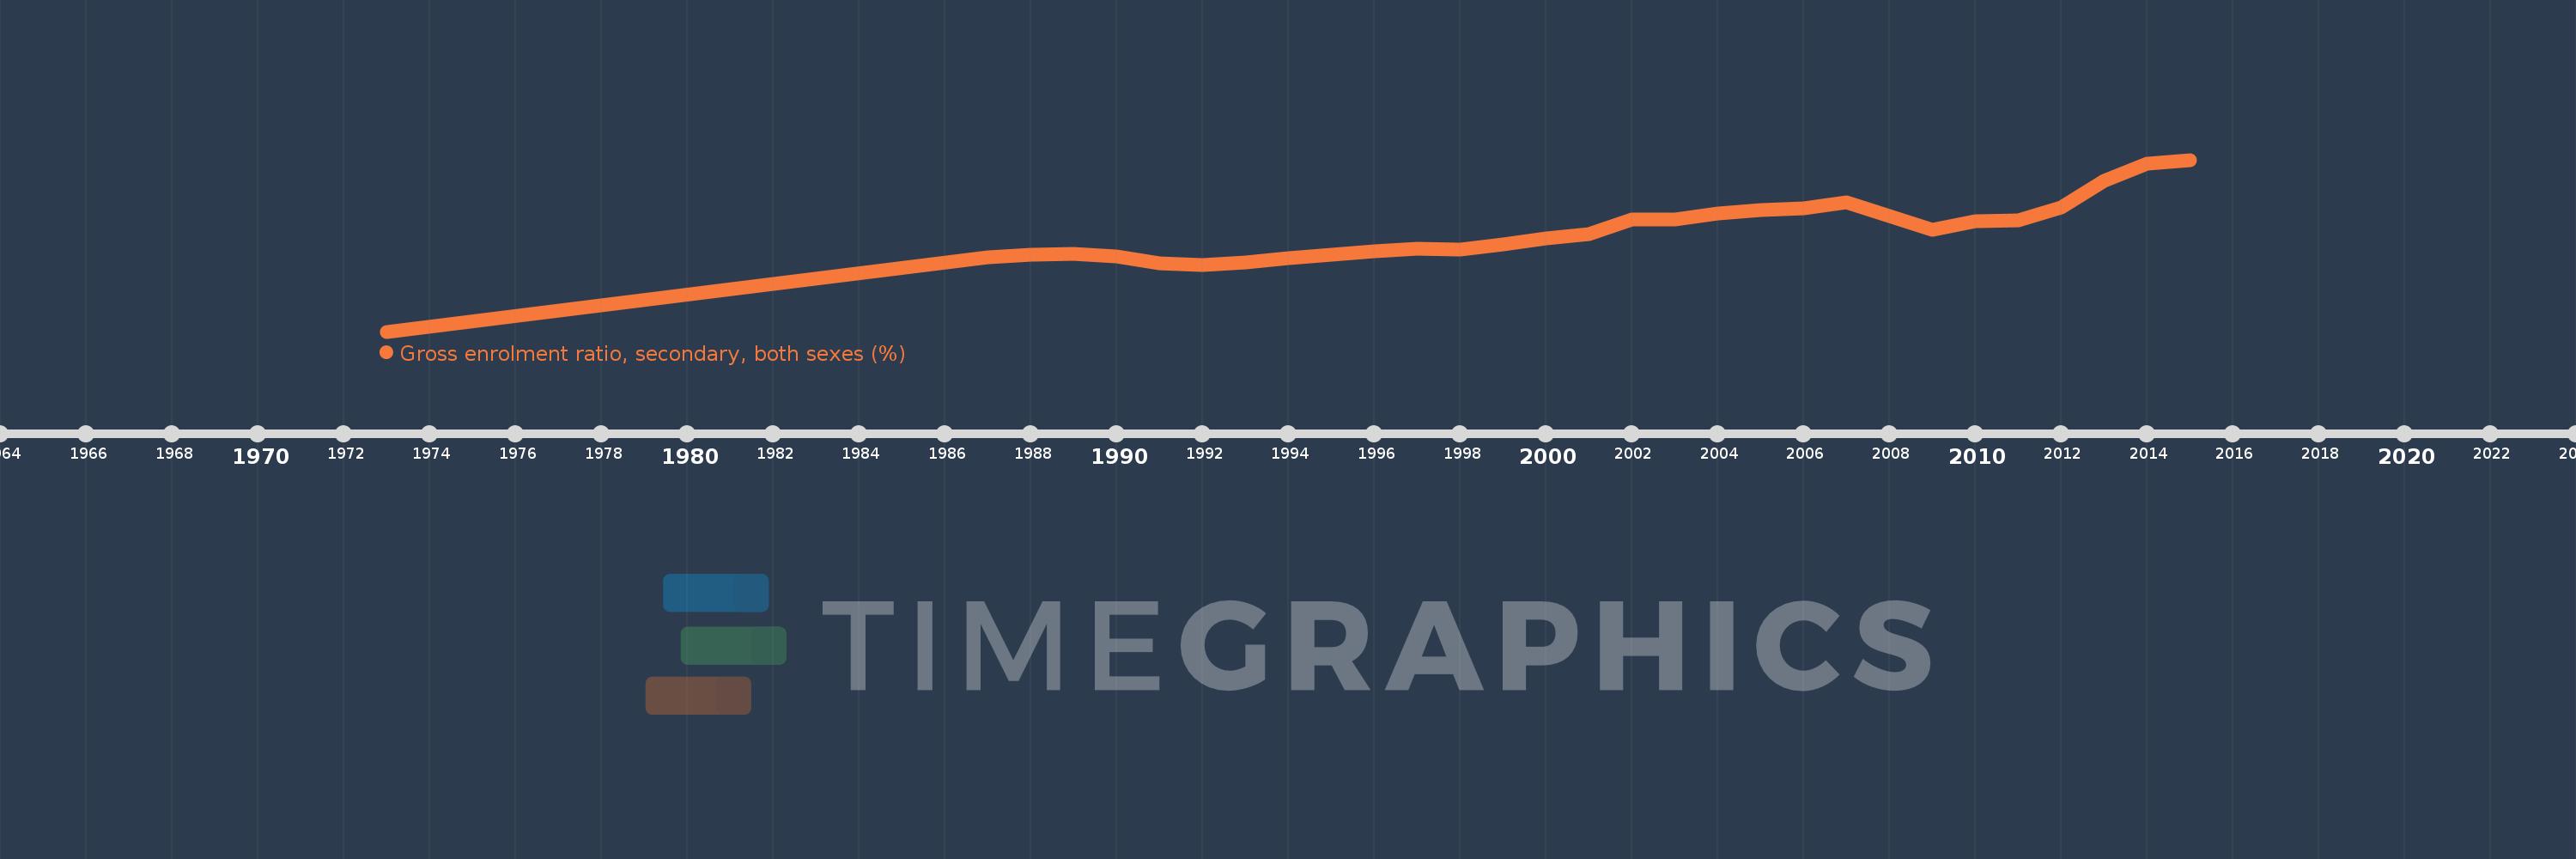
Gross enrolment ratio, secondary, both sexes (%)
2015,2014,2013,2012,2011,2010,2009,2007,2006,2005,2004,2003,2002,2001,2000,1999,1998,1997,1996,1995,1994,1993,1992,1991,1990,1989,1988,1987,1982,1973
Diese Statistik in anderen Ländern:
AfghanistanAlbaniaAlgeriaAndorraAngolaAntigua and BarbudaArab WorldArgentinaArmeniaArubaAustraliaAustriaAzerbaijanBahamas, TheBahrainBangladeshBarbadosBelarusBelgiumBelizeBeninBermudaBhutanBoliviaBosnia and HerzegovinaBotswanaBrazilBritish Virgin IslandsBrunei DarussalamBulgariaBurkina FasoBurundiCabo VerdeCambodiaCameroonCanadaCaribbean small statesCentral African RepublicCentral Europe and the BalticsChadChileChinaColombiaComorosCongo, Dem. Rep.Congo, Rep.Costa RicaCote d'IvoireCroatiaCubaCuracaoCyprusCzech RepublicDenmarkDjiboutiDominicaDominican RepublicEarly-demographic dividendEast Asia & PacificEast Asia & Pacific (excluding high income)East Asia & Pacific (IDA & IBRD countries)EcuadorEgypt, Arab Rep.El SalvadorEquatorial GuineaEritreaEstoniaEthiopiaEuro areaEurope & Central AsiaEurope & Central Asia (excluding high income)Europe & Central Asia (IDA & IBRD countries)European UnionFijiFinlandFragile and conflict affected situationsFranceGabonGambia, TheGeorgiaGermanyGhanaGreeceGrenadaGuatemalaGuineaGuinea-BissauGuyanaHaitiHeavily indebted poor countries (HIPC)High incomeHondurasHong Kong SAR, ChinaHungaryIBRD onlyIcelandIDA & IBRD totalIDA blendIDA onlyIDA totalIndiaIndonesiaIran, Islamic Rep.IraqIrelandIsraelItalyJamaicaJapanJordanKazakhstanKenyaKiribatiKorea, Dem. People’s Rep.Korea, Rep.KuwaitKyrgyz RepublicLao PDRLate-demographic dividendLatin America & Caribbean Latin America & Caribbean (excluding high income)Latin America & the Caribbean (IDA & IBRD countries)LatviaLeast developed countries: UN classificationLebanonLesothoLiberiaLibyaLiechtensteinLithuaniaLow & middle incomeLow incomeLower middle incomeLuxembourgMacao SAR, ChinaMacedonia, FYRMadagascarMalawiMalaysiaMaldivesMaliMaltaMarshall IslandsMauritaniaMauritiusMexicoMicronesia, Fed. Sts.Middle East & North AfricaMiddle East & North Africa (excluding high income)Middle East & North Africa (IDA & IBRD countries)Middle incomeMoldovaMongoliaMontenegroMoroccoMozambiqueMyanmarNamibiaNauruNepalNetherlandsNew ZealandNicaraguaNigerNigeriaNorth AmericaNorwayOECD membersOmanOther small statesPacific island small statesPakistanPalauPanamaPapua New GuineaParaguayPeruPhilippinesPolandPortugalPost-demographic dividendPre-demographic dividendPuerto RicoQatarRomaniaRussian FederationRwandaSamoaSan MarinoSao Tome and PrincipeSaudi ArabiaSenegalSerbiaSeychellesSierra LeoneSlovak RepublicSloveniaSmall statesSolomon IslandsSomaliaSouth AfricaSouth AsiaSouth Asia (IDA & IBRD)SpainSri LankaSt. Kitts and NevisSt. LuciaSt. Vincent and the GrenadinesSub-Saharan Africa Sub-Saharan Africa (excluding high income)Sub-Saharan Africa (IDA & IBRD countries)SudanSurinameSwazilandSwedenSwitzerlandSyrian Arab RepublicTajikistanTanzaniaThailandTimor-LesteTogoTongaTrinidad and TobagoTunisiaTurkeyTurkmenistanTuvaluUgandaUkraineUnited Arab EmiratesUnited KingdomUnited StatesUpper middle incomeUruguayUzbekistanVanuatuVenezuela, RBVietnamWest Bank and GazaWorldYemen, Rep.ZambiaZimbabwe Zeitlinie:
Diese Zeitleiste vorliegt die Graphik ab 1973 J. bis 2015 J. Mauritania. Die Angaben bis 1972 J. sind nicht vorhanden. Die Zahl aktueller Beobachtungen nach Daten: 30.
Die Quelle (Bezeichnung):
Kennzahlen der Weltentwicklung
Die Quelle (Einrichtung):
UNESCO Institute for Statistics
Kategorien:
Education
Es wurde aktualisiert:
23 Apr 2017 Jahr
Kennzahlen der Wertänderungen vom Jahr zum Jahr
Minimum:
2.576
1 Jan 1973 Jahr
Maximum:
29.935
1 Jan 2015 Jahr
Zum Datum der Beobachtung
Wert
Absolute Veränderung
Die Veränderung bezüglich dem vorherigen Wert
1 Jan 1973 Jahr
2.576
+2.576
0.0%
1 Jan 1982 Jahr
10.22
+7.643
296.66%
1 Jan 1987 Jahr
14.429
+4.209
41.19%
1 Jan 1988 Jahr
14.831
+0.402
2.78%
1 Jan 1989 Jahr
14.971
+0.14
0.95%
1 Jan 1990 Jahr
14.492
-0.479
-3.2%
1 Jan 1991 Jahr
13.422
-1.07
-7.38%
1 Jan 1992 Jahr
13.147
-0.275
-2.05%
1 Jan 1993 Jahr
13.553
+0.406
3.09%
1 Jan 1994 Jahr
14.267
+0.714
5.27%
1 Jan 1995 Jahr
14.784
+0.517
3.62%
1 Jan 1996 Jahr
15.39
+0.606
4.1%
1 Jan 1997 Jahr
15.817
+0.428
2.78%
1 Jan 1998 Jahr
15.641
-0.177
-1.12%
1 Jan 1999 Jahr
16.457
+0.816
5.22%
1 Jan 2000 Jahr
17.443
+0.986
5.99%
1 Jan 2001 Jahr
18.038
+0.595
3.41%
1 Jan 2002 Jahr
20.487
+2.449
13.58%
1 Jan 2003 Jahr
20.464
-0.023
-0.11%
1 Jan 2004 Jahr
21.343
+0.879
4.3%
1 Jan 2005 Jahr
21.887
+0.544
2.55%
1 Jan 2006 Jahr
22.252
+0.365
1.67%
1 Jan 2007 Jahr
23.145
+0.892
4.01%
1 Jan 2009 Jahr
18.825
-4.32
-18.66%
1 Jan 2010 Jahr
20.131
+1.307
6.94%
1 Jan 2011 Jahr
20.328
+0.197
0.98%
1 Jan 2012 Jahr
22.383
+2.055
10.11%
1 Jan 2013 Jahr
26.624
+4.24
18.94%
1 Jan 2014 Jahr
29.367
+2.744
10.3%
1 Jan 2015 Jahr
29.935
+0.568
1.93%
Bewertung der Länder gemäß mit laufender Statistik nach Jahren


Kommentare: