29
/de/
de
AIzaSyAYiBZKx7MnpbEhh9jyipgxe19OcubqV5w
April 1, 2024
191778
Malta
MLT
true
2
1
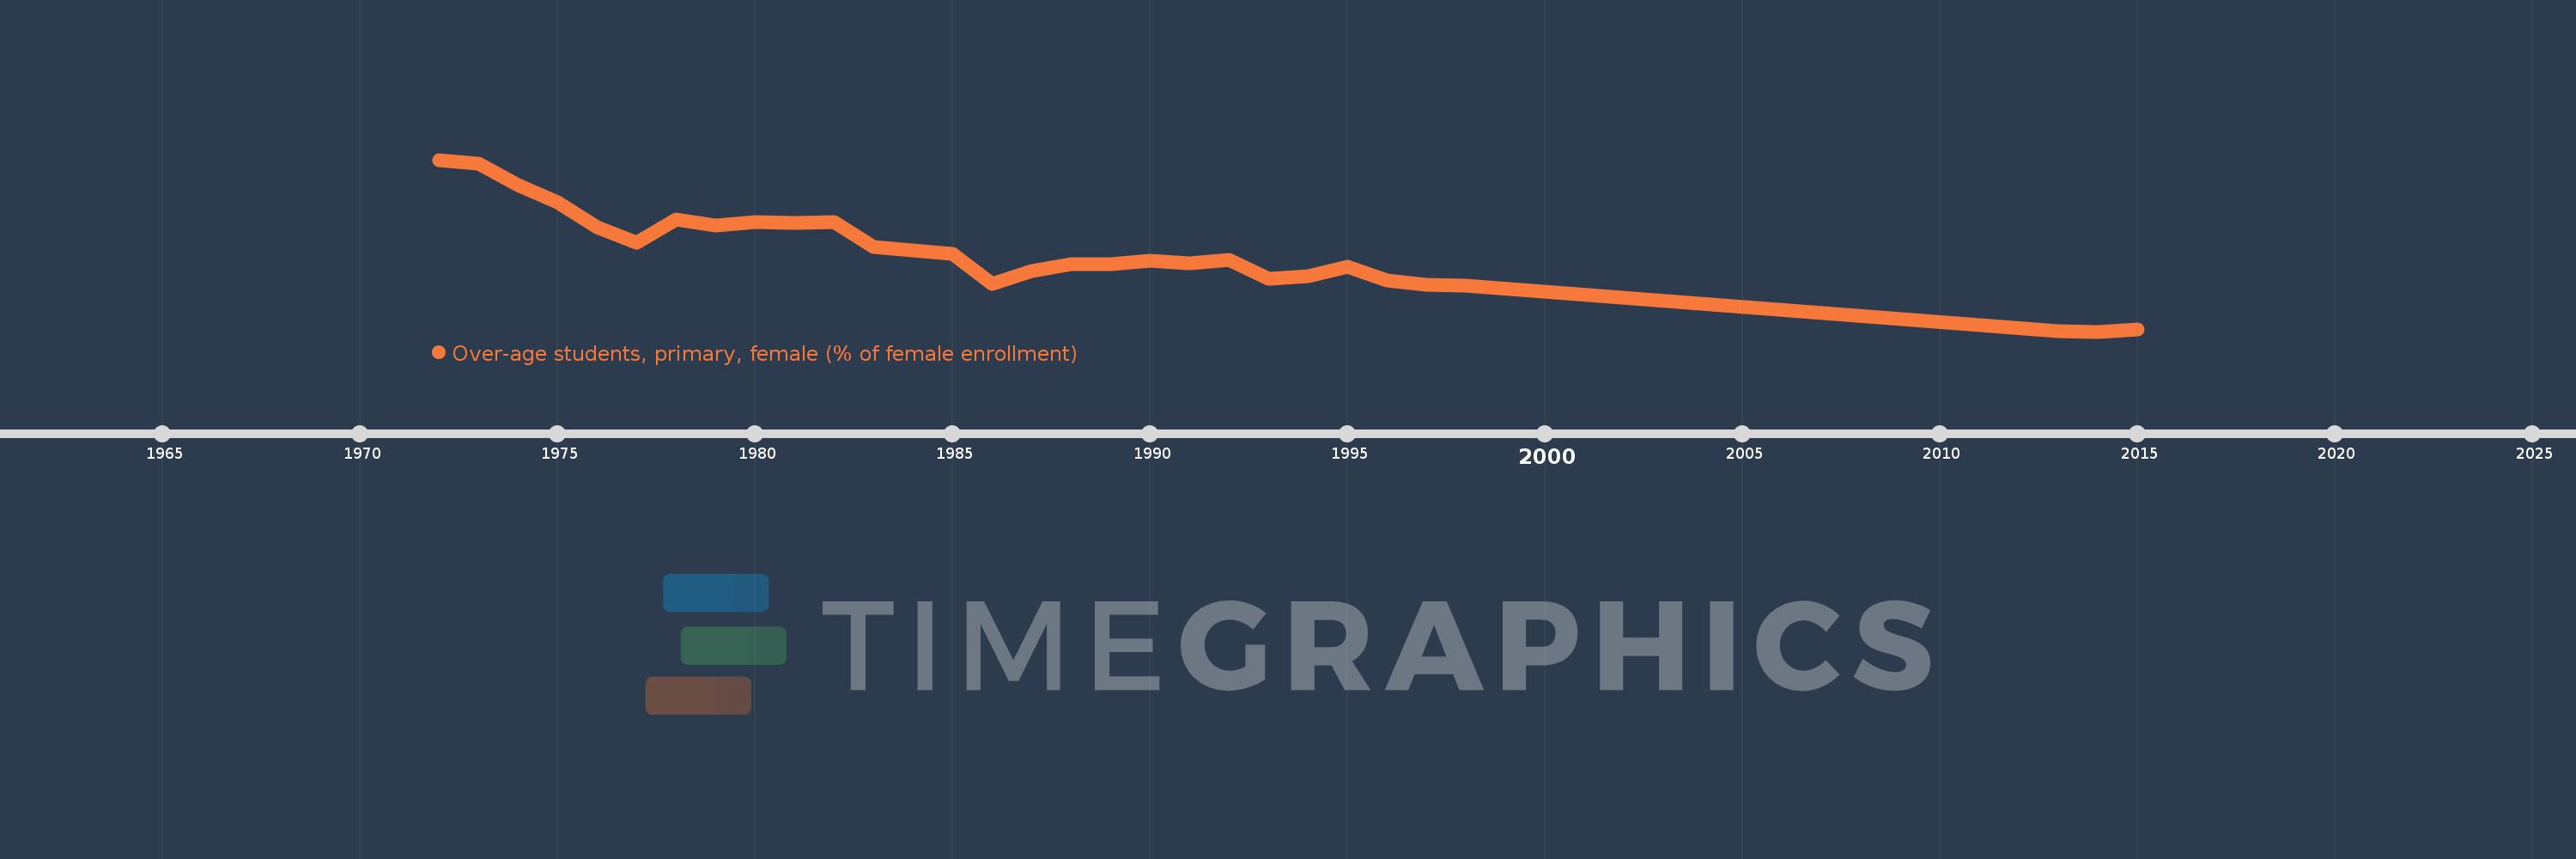
Over-age students, primary, female (% of female enrollment)
2015,2014,2013,1998,1997,1996,1995,1994,1993,1992,1991,1990,1989,1988,1987,1986,1985,1984,1983,1982,1981,1980,1979,1978,1977,1976,1975,1974,1973,1972
Diese Statistik in anderen Ländern:
AfghanistanAlbaniaAlgeriaAndorraAngolaAntigua and BarbudaArgentinaArubaAustraliaAustriaAzerbaijanBahamas, TheBahrainBangladeshBarbadosBelarusBelgiumBelizeBeninBermudaBhutanBoliviaBosnia and HerzegovinaBotswanaBritish Virgin IslandsBrunei DarussalamBulgariaBurkina FasoBurundiCabo VerdeCambodiaCameroonCanadaCentral African RepublicChadChileChinaColombiaComorosCongo, Dem. Rep.Congo, Rep.Costa RicaCote d'IvoireCubaCyprusDenmarkDjiboutiDominicaDominican RepublicEcuadorEgypt, Arab Rep.El SalvadorEquatorial GuineaEritreaEstoniaEthiopiaFijiFinlandFranceGabonGambia, TheGeorgiaGermanyGhanaGreeceGrenadaGuatemalaGuineaGuinea-BissauGuyanaHaitiHondurasHong Kong SAR, ChinaHungaryIcelandIndiaIndonesiaIran, Islamic Rep.IraqIrelandItalyJamaicaJapanJordanKazakhstanKenyaKiribatiKorea, Dem. People’s Rep.Korea, Rep.KuwaitKyrgyz RepublicLao PDRLebanonLesothoLibyaLuxembourgMacao SAR, ChinaMadagascarMalawiMalaysiaMaldivesMaliMaltaMarshall IslandsMauritaniaMauritiusMexicoMoldovaMongoliaMontenegroMoroccoMozambiqueMyanmarNamibiaNepalNetherlandsNew ZealandNicaraguaNigerNorwayOmanPakistanPalauPanamaParaguayPeruPhilippinesPolandPortugalPuerto RicoQatarRussian FederationRwandaSamoaSao Tome and PrincipeSaudi ArabiaSenegalSerbiaSeychellesSierra LeoneSingaporeSint Maarten (Dutch part)SloveniaSolomon IslandsSomaliaSouth AfricaSouth SudanSpainSri LankaSt. Kitts and NevisSt. LuciaSt. Vincent and the GrenadinesSurinameSwazilandSwedenSwitzerlandSyrian Arab RepublicTajikistanTanzaniaThailandTimor-LesteTogoTongaTrinidad and TobagoTunisiaTurkeyTurks and Caicos IslandsTuvaluUgandaUkraineUnited Arab EmiratesUnited KingdomUnited StatesUruguayVanuatuVenezuela, RBVietnamZambiaZimbabwe Zeitlinie:
Diese Zeitleiste vorliegt die Graphik ab 1972 J. bis 2015 J. Malta. Die Angaben bis 1971 J. sind nicht vorhanden. Die Zahl aktueller Beobachtungen nach Daten: 30.
Die Quelle (Bezeichnung):
Kennzahlen der Weltentwicklung
Die Quelle (Einrichtung):
United Nations Educational, Scientific, and Cultural Organization (UNESCO) Institute for Statistics.
Kategorien:
Education
Es wurde aktualisiert:
23 Apr 2017 Jahr
Kennzahlen der Wertänderungen vom Jahr zum Jahr
Minimum:
0.59
1 Jan 2014 Jahr
Maximum:
20.205
1 Jan 1972 Jahr
Zum Datum der Beobachtung
Wert
Absolute Veränderung
Die Veränderung bezüglich dem vorherigen Wert
1 Jan 1972 Jahr
20.205
+20.205
0.0%
1 Jan 1973 Jahr
19.735
-0.47
-2.32%
1 Jan 1974 Jahr
17.324
-2.411
-12.22%
1 Jan 1975 Jahr
15.385
-1.939
-11.19%
1 Jan 1976 Jahr
12.481
-2.904
-18.87%
1 Jan 1977 Jahr
10.702
-1.78
-14.26%
1 Jan 1978 Jahr
13.372
+2.67
24.95%
1 Jan 1979 Jahr
12.72
-0.652
-4.87%
1 Jan 1980 Jahr
13.081
+0.361
2.84%
1 Jan 1981 Jahr
12.956
-0.125
-0.96%
1 Jan 1982 Jahr
13.09
+0.134
1.03%
1 Jan 1983 Jahr
10.239
-2.85
-21.77%
1 Jan 1984 Jahr
9.879
-0.361
-3.52%
1 Jan 1985 Jahr
9.451
-0.428
-4.33%
1 Jan 1986 Jahr
6.077
-3.374
-35.7%
1 Jan 1987 Jahr
7.499
+1.423
23.41%
1 Jan 1988 Jahr
8.261
+0.761
10.15%
1 Jan 1989 Jahr
8.32
+0.059
0.72%
1 Jan 1990 Jahr
8.694
+0.374
4.5%
1 Jan 1991 Jahr
8.383
-0.312
-3.58%
1 Jan 1992 Jahr
8.781
+0.399
4.76%
1 Jan 1993 Jahr
6.597
-2.184
-24.87%
1 Jan 1994 Jahr
6.88
+0.282
4.28%
1 Jan 1995 Jahr
8.009
+1.129
16.41%
1 Jan 1996 Jahr
6.449
-1.56
-19.48%
1 Jan 1997 Jahr
5.935
-0.514
-7.97%
1 Jan 1998 Jahr
5.883
-0.052
-0.88%
1 Jan 2013 Jahr
0.627
-5.256
-89.34%
1 Jan 2014 Jahr
0.59
-0.037
-5.97%
1 Jan 2015 Jahr
0.867
+0.277
46.94%
Bewertung der Länder gemäß mit laufender Statistik nach Jahren


Kommentare: