29
/de/
de
AIzaSyAYiBZKx7MnpbEhh9jyipgxe19OcubqV5w
April 1, 2024
188430
Malaysia
MYS
true
2
1
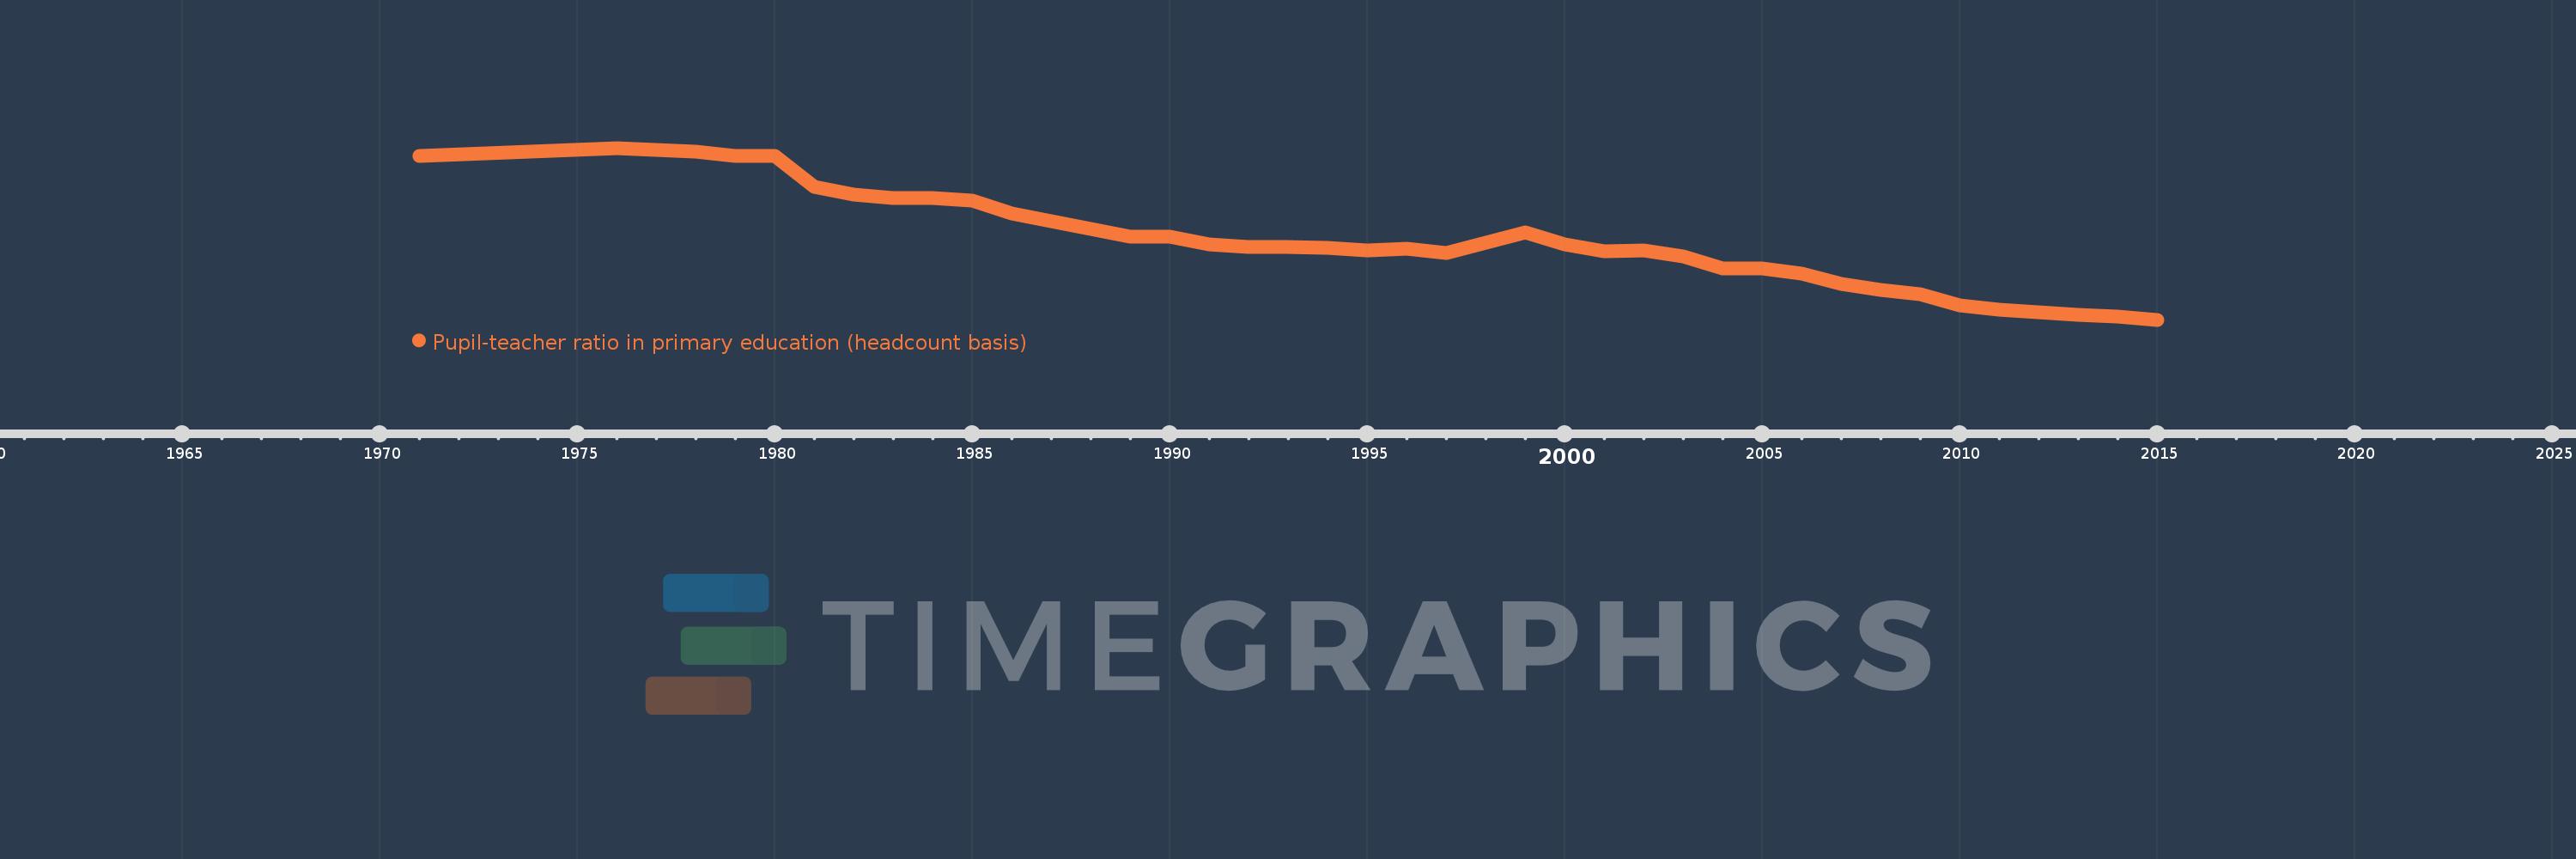
Pupil-teacher ratio in primary education (headcount basis)
2015,2014,2013,2012,2011,2010,2009,2008,2007,2006,2005,2004,2003,2002,2001,2000,1999,1997,1996,1995,1994,1993,1992,1991,1990,1989,1988,1986,1985,1984,1983,1982,1981,1980,1979,1978,1976,1971
Diese Statistik in anderen Ländern:
AfghanistanAlbaniaAlgeriaAndorraAngolaAntigua and BarbudaArab WorldArgentinaArmeniaArubaAustraliaAustriaAzerbaijanBahamas, TheBahrainBangladeshBarbadosBelarusBelgiumBelizeBeninBermudaBhutanBoliviaBosnia and HerzegovinaBotswanaBrazilBritish Virgin IslandsBrunei DarussalamBulgariaBurkina FasoBurundiCabo VerdeCambodiaCameroonCanadaCaribbean small statesCayman IslandsCentral African RepublicCentral Europe and the BalticsChadChileChinaColombiaComorosCongo, Dem. Rep.Congo, Rep.Costa RicaCote d'IvoireCroatiaCubaCyprusCzech RepublicDenmarkDjiboutiDominicaDominican RepublicEarly-demographic dividendEast Asia & PacificEast Asia & Pacific (excluding high income)East Asia & Pacific (IDA & IBRD countries)EcuadorEgypt, Arab Rep.El SalvadorEquatorial GuineaEritreaEstoniaEthiopiaEuro areaEurope & Central AsiaEurope & Central Asia (excluding high income)Europe & Central Asia (IDA & IBRD countries)European UnionFijiFinlandFragile and conflict affected situationsFranceGabonGambia, TheGeorgiaGermanyGhanaGibraltarGreeceGrenadaGuatemalaGuineaGuinea-BissauGuyanaHaitiHeavily indebted poor countries (HIPC)High incomeHondurasHong Kong SAR, ChinaHungaryIBRD onlyIcelandIDA & IBRD totalIDA blendIDA onlyIDA totalIndiaIndonesiaIran, Islamic Rep.IraqIrelandIsraelItalyJamaicaJapanJordanKazakhstanKenyaKiribatiKorea, Dem. People’s Rep.Korea, Rep.KuwaitKyrgyz RepublicLao PDRLate-demographic dividendLatin America & Caribbean Latin America & Caribbean (excluding high income)Latin America & the Caribbean (IDA & IBRD countries)LatviaLeast developed countries: UN classificationLebanonLesothoLiberiaLibyaLiechtensteinLithuaniaLow & middle incomeLow incomeLower middle incomeLuxembourgMacao SAR, ChinaMacedonia, FYRMadagascarMalawiMalaysiaMaldivesMaliMaltaMarshall IslandsMauritaniaMauritiusMexicoMicronesia, Fed. Sts.Middle East & North AfricaMiddle East & North Africa (excluding high income)Middle East & North Africa (IDA & IBRD countries)Middle incomeMoldovaMonacoMongoliaMoroccoMozambiqueMyanmarNamibiaNauruNepalNetherlandsNew ZealandNicaraguaNigerNigeriaNorth AmericaNorwayOECD membersOmanOther small statesPacific island small statesPakistanPalauPanamaPapua New GuineaParaguayPeruPhilippinesPolandPortugalPost-demographic dividendPre-demographic dividendPuerto RicoQatarRomaniaRussian FederationRwandaSamoaSan MarinoSao Tome and PrincipeSaudi ArabiaSenegalSerbiaSeychellesSierra LeoneSingaporeSint Maarten (Dutch part)Slovak RepublicSloveniaSmall statesSolomon IslandsSomaliaSouth AfricaSouth AsiaSouth Asia (IDA & IBRD)South SudanSpainSri LankaSt. Kitts and NevisSt. LuciaSt. Vincent and the GrenadinesSub-Saharan Africa Sub-Saharan Africa (excluding high income)Sub-Saharan Africa (IDA & IBRD countries)SudanSurinameSwazilandSwedenSwitzerlandSyrian Arab RepublicTajikistanTanzaniaThailandTimor-LesteTogoTongaTrinidad and TobagoTunisiaTurkeyTurks and Caicos IslandsTuvaluUgandaUkraineUnited Arab EmiratesUnited KingdomUnited StatesUpper middle incomeUruguayUzbekistanVanuatuVenezuela, RBVietnamWest Bank and GazaWorldYemen, Rep.ZambiaZimbabwe Zeitlinie:
Diese Zeitleiste vorliegt die Graphik ab 1971 J. bis 2015 J. Malaysia. Die Angaben bis 1970 J. sind nicht vorhanden. Die Zahl aktueller Beobachtungen nach Daten: 38.
Die Quelle (Bezeichnung):
Kennzahlen der Weltentwicklung
Die Quelle (Einrichtung):
UNESCO Institute for Statistics
Kategorien:
Education
Es wurde aktualisiert:
23 Apr 2017 Jahr
Kennzahlen der Wertänderungen vom Jahr zum Jahr
Minimum:
11.413
1 Jan 2015 Jahr
Maximum:
31.905
1 Jan 1976 Jahr
Zum Datum der Beobachtung
Wert
Absolute Veränderung
Die Veränderung bezüglich dem vorherigen Wert
1 Jan 1971 Jahr
30.98
+30.98
0.0%
1 Jan 1976 Jahr
31.905
+0.925
2.98%
1 Jan 1978 Jahr
31.5
-0.405
-1.27%
1 Jan 1979 Jahr
30.931
-0.569
-1.81%
1 Jan 1980 Jahr
30.903
-0.028
-0.09%
1 Jan 1981 Jahr
27.272
-3.631
-11.75%
1 Jan 1982 Jahr
26.385
-0.887
-3.25%
1 Jan 1983 Jahr
25.971
-0.413
-1.57%
1 Jan 1984 Jahr
25.961
-0.01
-0.04%
1 Jan 1985 Jahr
25.654
-0.307
-1.18%
1 Jan 1986 Jahr
24.054
-1.6
-6.24%
1 Jan 1988 Jahr
22.221
-1.833
-7.62%
1 Jan 1989 Jahr
21.343
-0.878
-3.95%
1 Jan 1990 Jahr
21.37
+0.027
0.13%
1 Jan 1991 Jahr
20.377
-0.993
-4.65%
1 Jan 1992 Jahr
20.141
-0.236
-1.16%
1 Jan 1993 Jahr
20.128
-0.014
-0.07%
1 Jan 1994 Jahr
20.015
-0.112
-0.56%
1 Jan 1995 Jahr
19.7
-0.316
-1.58%
1 Jan 1996 Jahr
19.937
+0.237
1.21%
1 Jan 1997 Jahr
19.416
-0.521
-2.61%
1 Jan 1999 Jahr
21.804
+2.388
12.3%
1 Jan 2000 Jahr
20.363
-1.441
-6.61%
1 Jan 2001 Jahr
19.558
-0.805
-3.95%
1 Jan 2002 Jahr
19.665
+0.107
0.55%
1 Jan 2003 Jahr
18.92
-0.745
-3.79%
1 Jan 2004 Jahr
17.514
-1.406
-7.43%
1 Jan 2005 Jahr
17.486
-0.028
-0.16%
1 Jan 2006 Jahr
16.895
-0.591
-3.38%
1 Jan 2007 Jahr
15.655
-1.24
-7.34%
1 Jan 2008 Jahr
14.984
-0.671
-4.28%
1 Jan 2009 Jahr
14.442
-0.542
-3.62%
1 Jan 2010 Jahr
13.135
-1.307
-9.05%
1 Jan 2011 Jahr
12.601
-0.534
-4.07%
1 Jan 2012 Jahr
12.324
-0.277
-2.2%
1 Jan 2013 Jahr
12.004
-0.321
-2.6%
1 Jan 2014 Jahr
11.831
-0.172
-1.44%
1 Jan 2015 Jahr
11.413
-0.419
-3.54%
Bewertung der Länder gemäß mit laufender Statistik nach Jahren


Kommentare: