29
/de/
de
AIzaSyAYiBZKx7MnpbEhh9jyipgxe19OcubqV5w
April 1, 2024
186913
Malawi
MWI
true
2
1
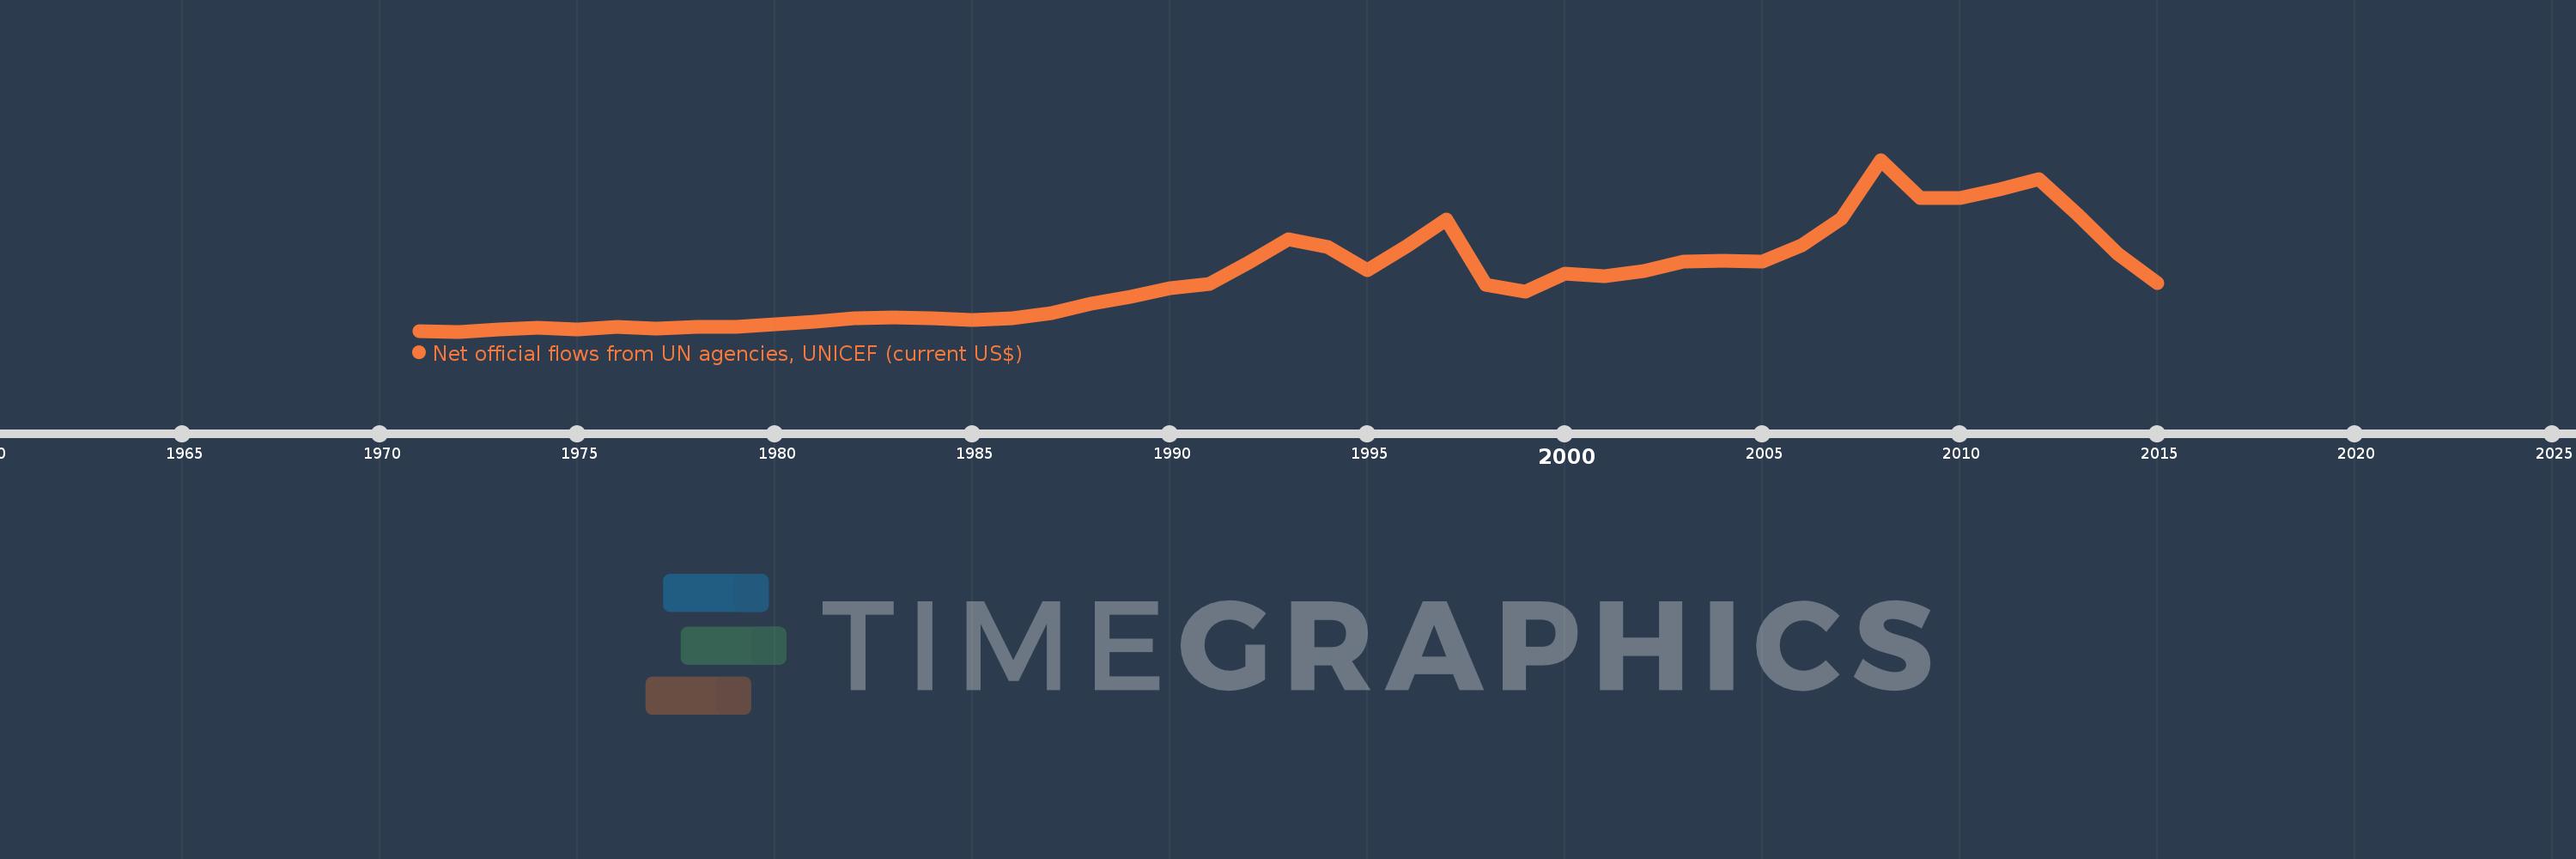
Net official flows from UN agencies, UNICEF (current US$)
2015,2014,2013,2012,2011,2010,2009,2008,2007,2006,2005,2004,2003,2002,2001,2000,1999,1998,1997,1996,1995,1994,1993,1992,1991,1990,1989,1988,1987,1986,1985,1984,1983,1982,1981,1980,1979,1978,1977,1976,1975,1974,1973,1972,1971
Diese Statistik in anderen Ländern:
AfghanistanAlbaniaAlgeriaAngolaAntigua and BarbudaArab WorldArgentinaArmeniaAzerbaijanBahamas, TheBahrainBangladeshBarbadosBelarusBelizeBeninBhutanBoliviaBosnia and HerzegovinaBotswanaBrazilBulgariaBurkina FasoBurundiCabo VerdeCambodiaCameroonCaribbean small statesCentral African RepublicCentral Europe and the BalticsChadChileChinaColombiaComorosCongo, Dem. Rep.Congo, Rep.Costa RicaCote d'IvoireCroatiaCubaCyprusDjiboutiDominicaDominican RepublicEast Asia & PacificEast Asia & Pacific (excluding high income)East Asia & Pacific (IDA & IBRD countries)EcuadorEgypt, Arab Rep.El SalvadorEquatorial GuineaEritreaEthiopiaEuro areaEurope & Central AsiaEurope & Central Asia (excluding high income)Europe & Central Asia (IDA & IBRD countries)European UnionFijiFragile and conflict affected situationsGabonGambia, TheGeorgiaGhanaGrenadaGuatemalaGuineaGuinea-BissauGuyanaHaitiHeavily indebted poor countries (HIPC)High incomeHondurasHong Kong SAR, ChinaIBRD onlyIDA & IBRD totalIDA blendIDA onlyIDA totalIndiaIndonesiaIran, Islamic Rep.IraqJamaicaJordanKazakhstanKenyaKorea, Dem. People’s Rep.Korea, Rep.KosovoKuwaitKyrgyz RepublicLao PDRLatin America & Caribbean Latin America & Caribbean (excluding high income)Latin America & the Caribbean (IDA & IBRD countries)LatviaLeast developed countries: UN classificationLebanonLesothoLiberiaLibyaLow & middle incomeLow incomeLower middle incomeMacedonia, FYRMadagascarMalawiMalaysiaMaldivesMaliMauritaniaMauritiusMexicoMiddle East & North AfricaMiddle East & North Africa (excluding high income)Middle East & North Africa (IDA & IBRD countries)Middle incomeMoldovaMongoliaMontenegroMoroccoMozambiqueMyanmarNamibiaNepalNicaraguaNigerNigeriaNorthern Mariana IslandsOECD membersOmanOther small statesPacific island small statesPakistanPanamaPapua New GuineaParaguayPeruPhilippinesRomaniaRussian FederationRwandaSamoaSao Tome and PrincipeSaudi ArabiaSenegalSerbiaSeychellesSierra LeoneSingaporeSmall statesSomaliaSouth AfricaSouth AsiaSouth Asia (IDA & IBRD)South SudanSri LankaSt. Kitts and NevisSt. LuciaSt. Vincent and the GrenadinesSub-Saharan Africa Sub-Saharan Africa (excluding high income)Sub-Saharan Africa (IDA & IBRD countries)SudanSurinameSwazilandSyrian Arab RepublicTajikistanTanzaniaThailandTimor-LesteTogoTrinidad and TobagoTunisiaTurkeyTurkmenistanUgandaUkraineUnited Arab EmiratesUpper middle incomeUruguayUzbekistanVanuatuVenezuela, RBVietnamWest Bank and GazaWorldYemen, Rep.ZambiaZimbabwe Zeitlinie:
Diese Zeitleiste vorliegt die Graphik ab 1971 J. bis 2015 J. Malawi. Die Angaben bis 1970 J. sind nicht vorhanden. Die Zahl aktueller Beobachtungen nach Daten: 45.
Die Quelle (Bezeichnung):
Kennzahlen der Weltentwicklung
Die Quelle (Einrichtung):
Development Assistance Committee of the Organisation for Economic Co-operation and Development, Geographical Distribution of Financial Flows to Developing Countries, Development Co-operation Report, and International Development Statistics database. Data are available online at: www.oecd.org/dac/stats/idsonline.
Kategorien:
Aid Effectiveness
Es wurde aktualisiert:
23 Apr 2017 Jahr
Kennzahlen der Wertänderungen vom Jahr zum Jahr
im Durchschnitt:
3.813 Mln.
Minimum:
110.0 Tsnd.
1 Jan 1972 Jahr
Maximum:
11.88 Mln.
1 Jan 2008 Jahr
Zum Datum der Beobachtung
Wert
Absolute Veränderung
Die Veränderung bezüglich dem vorherigen Wert
1 Jan 1971 Jahr
140.0 Tsnd.
+140.0 Tsnd.
0.0%
1 Jan 1972 Jahr
110.0 Tsnd.
-30.0 Tsnd.
-21.43%
1 Jan 1973 Jahr
270.0 Tsnd.
+160.0 Tsnd.
145.45%
1 Jan 1974 Jahr
350.0 Tsnd.
+80.0 Tsnd.
29.63%
1 Jan 1975 Jahr
230.0 Tsnd.
-120.0 Tsnd.
-34.29%
1 Jan 1976 Jahr
440.0 Tsnd.
+210.0 Tsnd.
91.3%
1 Jan 1977 Jahr
300.0 Tsnd.
-140.0 Tsnd.
-31.82%
1 Jan 1978 Jahr
420.0 Tsnd.
+120.0 Tsnd.
40.0%
1 Jan 1979 Jahr
450.0 Tsnd.
+30.0 Tsnd.
7.14%
1 Jan 1980 Jahr
590.0 Tsnd.
+140.0 Tsnd.
31.11%
1 Jan 1981 Jahr
800.0 Tsnd.
+210.0 Tsnd.
35.59%
1 Jan 1982 Jahr
1000.0 Tsnd.
+200.0 Tsnd.
25.0%
1 Jan 1983 Jahr
1.06 Mln.
+60.0 Tsnd.
6.0%
1 Jan 1984 Jahr
1.04 Mln.
-20.0 Tsnd.
-1.89%
1 Jan 1985 Jahr
910.0 Tsnd.
-130.0 Tsnd.
-12.5%
1 Jan 1986 Jahr
1000.0 Tsnd.
+90.0 Tsnd.
9.89%
1 Jan 1987 Jahr
1.37 Mln.
+370.0 Tsnd.
37.0%
1 Jan 1988 Jahr
2.01 Mln.
+640.0 Tsnd.
46.72%
1 Jan 1989 Jahr
2.51 Mln.
+500.0 Tsnd.
24.88%
1 Jan 1990 Jahr
3.06 Mln.
+550.0 Tsnd.
21.91%
1 Jan 1991 Jahr
3.35 Mln.
+290.0 Tsnd.
9.48%
1 Jan 1992 Jahr
4.87 Mln.
+1.52 Mln.
45.37%
1 Jan 1993 Jahr
6.42 Mln.
+1.55 Mln.
31.83%
1 Jan 1994 Jahr
5.91 Mln.
-510.0 Tsnd.
-7.94%
1 Jan 1995 Jahr
4.34 Mln.
-1.57 Mln.
-26.57%
1 Jan 1996 Jahr
5.99 Mln.
+1.65 Mln.
38.02%
1 Jan 1997 Jahr
7.77 Mln.
+1.78 Mln.
29.72%
1 Jan 1998 Jahr
3.32 Mln.
-4.45 Mln.
-57.27%
1 Jan 1999 Jahr
2.85 Mln.
-470.0 Tsnd.
-14.16%
1 Jan 2000 Jahr
4.11 Mln.
+1.26 Mln.
44.21%
1 Jan 2001 Jahr
3.93 Mln.
-180.0 Tsnd.
-4.38%
1 Jan 2002 Jahr
4.28 Mln.
+350.0 Tsnd.
8.91%
1 Jan 2003 Jahr
4.93 Mln.
+650.0 Tsnd.
15.19%
1 Jan 2004 Jahr
4.95 Mln.
+20.0 Tsnd.
0.41%
1 Jan 2005 Jahr
4.88 Mln.
-70.0 Tsnd.
-1.41%
1 Jan 2006 Jahr
6.05 Mln.
+1.17 Mln.
23.98%
1 Jan 2007 Jahr
7.82 Mln.
+1.77 Mln.
29.26%
1 Jan 2008 Jahr
11.88 Mln.
+4.06 Mln.
51.92%
1 Jan 2009 Jahr
9.24 Mln.
-2.64 Mln.
-22.22%
1 Jan 2010 Jahr
9.29 Mln.
+50.0 Tsnd.
0.54%
1 Jan 2011 Jahr
9.85 Mln.
+560.0 Tsnd.
6.03%
1 Jan 2012 Jahr
10.55 Mln.
+700.0 Tsnd.
7.11%
1 Jan 2013 Jahr
8.09 Mln.
-2.46 Mln.
-23.32%
1 Jan 2014 Jahr
5.44 Mln.
-2.65 Mln.
-32.76%
1 Jan 2015 Jahr
3.41 Mln.
-2.03 Mln.
-37.32%
Bewertung der Länder gemäß mit laufender Statistik nach Jahren


Kommentare: