29
/de/
de
AIzaSyAYiBZKx7MnpbEhh9jyipgxe19OcubqV5w
April 1, 2024
185156
Madagascar
MDG
true
2
1
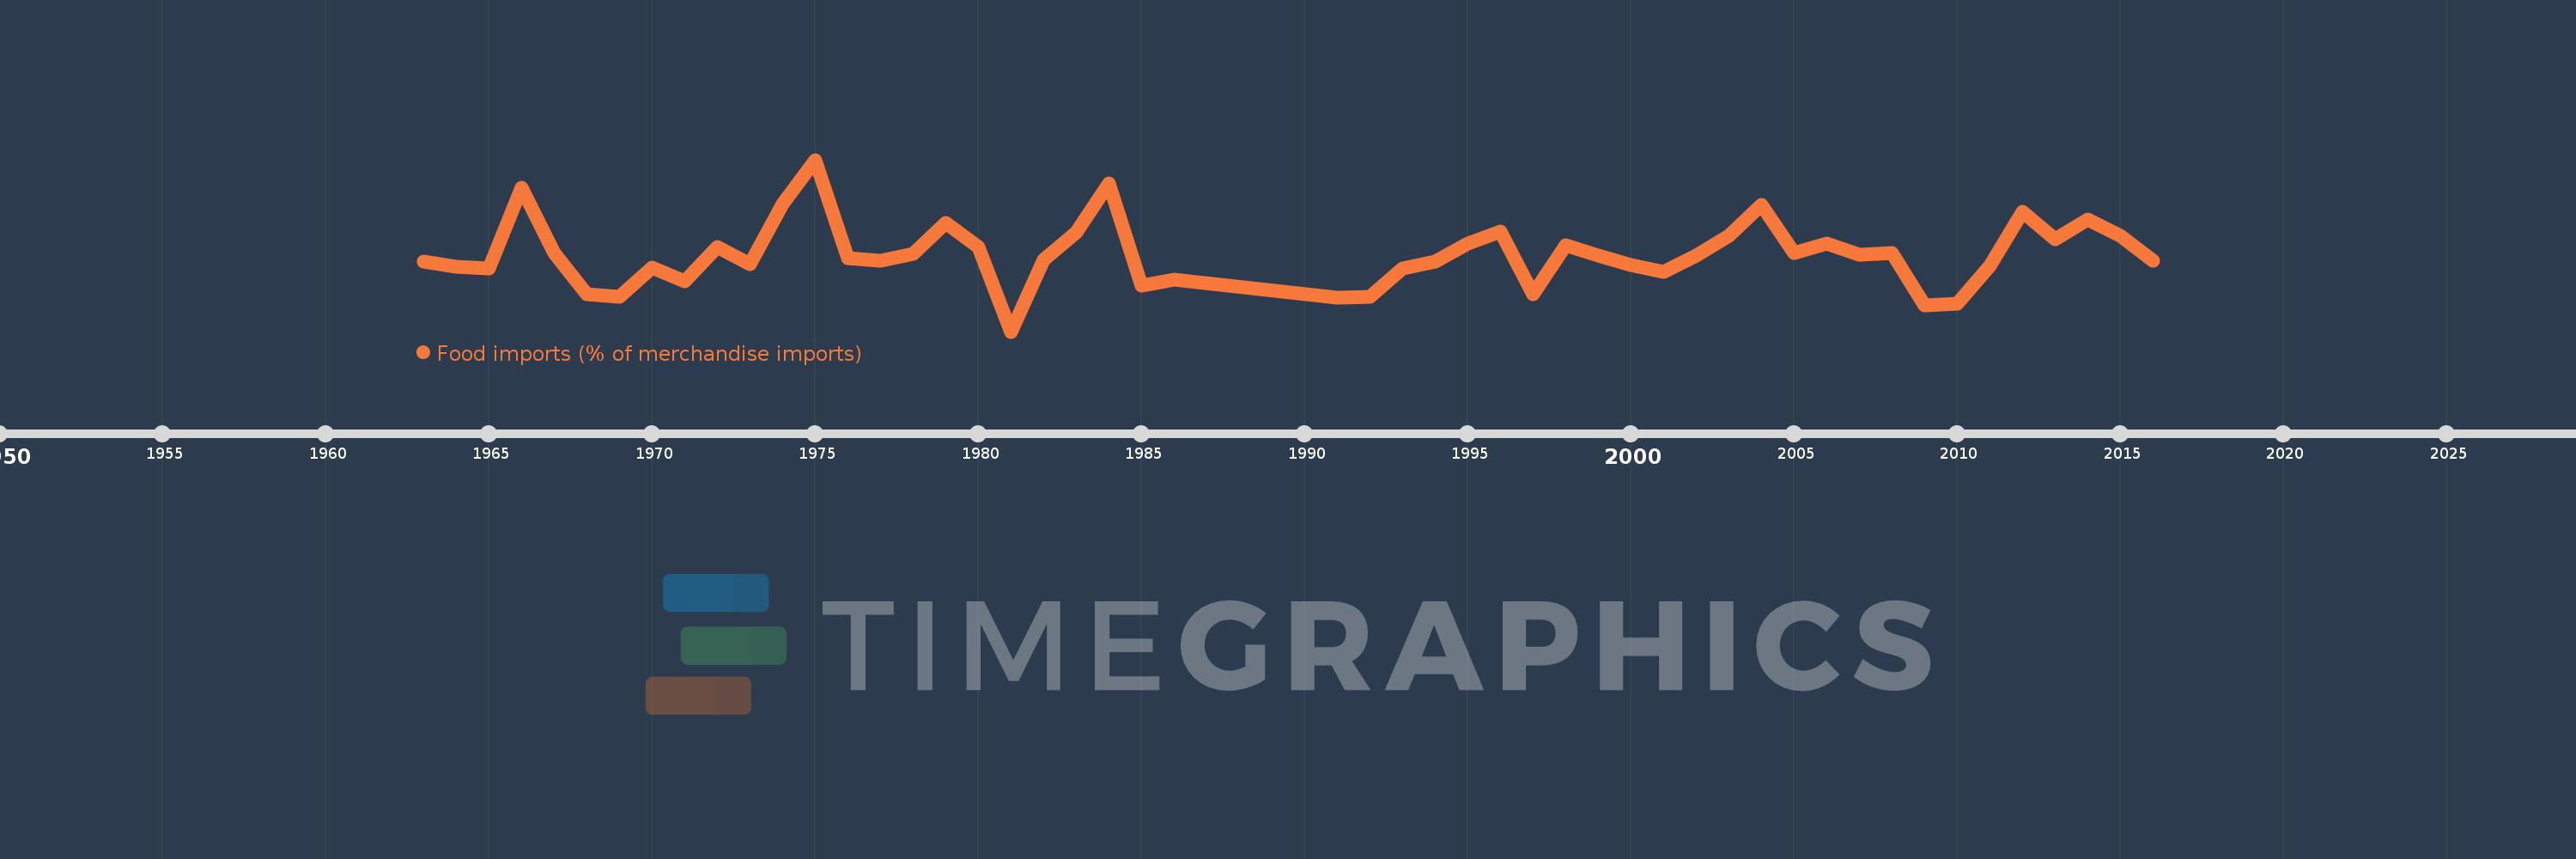
Food imports (% of merchandise imports)
2016,2015,2014,2013,2012,2011,2010,2009,2008,2007,2006,2005,2004,2003,2002,2001,2000,1999,1998,1997,1996,1995,1994,1993,1992,1991,1986,1985,1984,1983,1982,1981,1980,1979,1978,1977,1976,1975,1974,1973,1972,1971,1970,1969,1968,1967,1966,1965,1964,1963
Diese Statistik in anderen Ländern:
AfghanistanAlbaniaAlgeriaAndorraAngolaAntigua and BarbudaArab WorldArgentinaArmeniaArubaAustraliaAustriaAzerbaijanBahamas, TheBahrainBangladeshBarbadosBelarusBelgiumBelizeBeninBermudaBhutanBoliviaBosnia and HerzegovinaBotswanaBrazilBrunei DarussalamBulgariaBurkina FasoBurundiCabo VerdeCambodiaCameroonCanadaCaribbean small statesCayman IslandsCentral African RepublicCentral Europe and the BalticsChadChileChinaColombiaComorosCongo, Dem. Rep.Congo, Rep.Costa RicaCote d'IvoireCroatiaCubaCyprusCzech RepublicDenmarkDjiboutiDominicaDominican RepublicEarly-demographic dividendEast Asia & PacificEast Asia & Pacific (excluding high income)East Asia & Pacific (IDA & IBRD countries)EcuadorEgypt, Arab Rep.El SalvadorEquatorial GuineaEritreaEstoniaEthiopiaEuro areaEurope & Central AsiaEurope & Central Asia (excluding high income)Europe & Central Asia (IDA & IBRD countries)European UnionFaroe IslandsFijiFinlandFragile and conflict affected situationsFranceFrench PolynesiaGabonGambia, TheGeorgiaGermanyGhanaGreeceGreenlandGrenadaGuatemalaGuineaGuinea-BissauGuyanaHaitiHeavily indebted poor countries (HIPC)High incomeHondurasHong Kong SAR, ChinaHungaryIBRD onlyIcelandIDA & IBRD totalIDA blendIDA onlyIDA totalIndiaIndonesiaIran, Islamic Rep.IraqIrelandIsraelItalyJamaicaJapanJordanKazakhstanKenyaKiribatiKorea, Rep.KuwaitKyrgyz RepublicLao PDRLate-demographic dividendLatin America & Caribbean Latin America & Caribbean (excluding high income)Latin America & the Caribbean (IDA & IBRD countries)LatviaLeast developed countries: UN classificationLebanonLesothoLiberiaLibyaLithuaniaLow & middle incomeLow incomeLower middle incomeLuxembourgMacao SAR, ChinaMacedonia, FYRMadagascarMalawiMalaysiaMaldivesMaliMaltaMauritaniaMauritiusMexicoMiddle East & North AfricaMiddle East & North Africa (excluding high income)Middle East & North Africa (IDA & IBRD countries)Middle incomeMoldovaMongoliaMoroccoMozambiqueMyanmarNamibiaNepalNetherlandsNew CaledoniaNew ZealandNicaraguaNigerNigeriaNorth AmericaNorwayOECD membersOmanOther small statesPacific island small statesPakistanPalauPanamaPapua New GuineaParaguayPeruPhilippinesPolandPortugalPost-demographic dividendPre-demographic dividendQatarRomaniaRussian FederationRwandaSamoaSao Tome and PrincipeSaudi ArabiaSenegalSerbiaSeychellesSierra LeoneSingaporeSlovak RepublicSloveniaSmall statesSolomon IslandsSomaliaSouth AfricaSouth AsiaSouth Asia (IDA & IBRD)SpainSri LankaSt. Kitts and NevisSt. LuciaSt. Vincent and the GrenadinesSub-Saharan Africa Sub-Saharan Africa (excluding high income)Sub-Saharan Africa (IDA & IBRD countries)SudanSurinameSwazilandSwedenSwitzerlandSyrian Arab RepublicTajikistanTanzaniaThailandTimor-LesteTogoTongaTrinidad and TobagoTunisiaTurkeyTurkmenistanTurks and Caicos IslandsTuvaluUgandaUkraineUnited Arab EmiratesUnited KingdomUnited StatesUpper middle incomeUruguayVanuatuVenezuela, RBVietnamVirgin Islands (U.S.)WorldYemen, Rep.ZambiaZimbabwe Zeitlinie:
Diese Zeitleiste vorliegt die Graphik ab 1963 J. bis 2016 J. Madagascar. Die Angaben bis 1962 J. sind nicht vorhanden. Die Zahl aktueller Beobachtungen nach Daten: 50.
Die Quelle (Bezeichnung):
Kennzahlen der Weltentwicklung
Die Quelle (Einrichtung):
World Bank staff estimates from the Comtrade database maintained by the United Nations Statistics Division.
Kategorien:
Private Sector, Trade
Es wurde aktualisiert:
23 Apr 2017 Jahr
Kennzahlen der Wertänderungen vom Jahr zum Jahr
Minimum:
8.544
1 Jan 1981 Jahr
Maximum:
21.813
1 Jan 1975 Jahr
Zum Datum der Beobachtung
Wert
Absolute Veränderung
Die Veränderung bezüglich dem vorherigen Wert
1 Jan 1963 Jahr
13.977
+13.977
0.0%
1 Jan 1964 Jahr
13.522
-0.455
-3.26%
1 Jan 1965 Jahr
13.399
-0.123
-0.91%
1 Jan 1966 Jahr
19.662
+6.263
46.74%
1 Jan 1967 Jahr
14.641
-5.021
-25.54%
1 Jan 1968 Jahr
11.432
-3.209
-21.92%
1 Jan 1969 Jahr
11.237
-0.195
-1.71%
1 Jan 1970 Jahr
13.467
+2.23
19.85%
1 Jan 1971 Jahr
12.422
-1.045
-7.76%
1 Jan 1972 Jahr
15.107
+2.684
21.61%
1 Jan 1973 Jahr
13.752
-1.354
-8.97%
1 Jan 1974 Jahr
18.422
+4.67
33.96%
1 Jan 1975 Jahr
21.813
+3.391
18.4%
1 Jan 1976 Jahr
14.211
-7.601
-34.85%
1 Jan 1977 Jahr
14.043
-0.169
-1.19%
1 Jan 1978 Jahr
14.545
+0.503
3.58%
1 Jan 1979 Jahr
16.916
+2.371
16.3%
1 Jan 1980 Jahr
15.101
-1.815
-10.73%
1 Jan 1981 Jahr
8.544
-6.556
-43.42%
1 Jan 1982 Jahr
14.086
+5.542
64.86%
1 Jan 1983 Jahr
16.201
+2.115
15.01%
1 Jan 1984 Jahr
20.01
+3.809
23.51%
1 Jan 1985 Jahr
12.081
-7.929
-39.63%
1 Jan 1986 Jahr
12.582
+0.501
4.15%
1 Jan 1991 Jahr
11.18
-1.402
-11.14%
1 Jan 1992 Jahr
11.235
+0.055
0.49%
1 Jan 1993 Jahr
13.392
+2.158
19.2%
1 Jan 1994 Jahr
13.978
+0.586
4.38%
1 Jan 1995 Jahr
15.314
+1.336
9.55%
1 Jan 1996 Jahr
16.259
+0.945
6.17%
1 Jan 1997 Jahr
11.414
-4.846
-29.8%
1 Jan 1998 Jahr
15.184
+3.77
33.03%
1 Jan 1999 Jahr
14.41
-0.774
-5.1%
1 Jan 2000 Jahr
13.673
-0.737
-5.12%
1 Jan 2001 Jahr
13.175
-0.498
-3.64%
1 Jan 2002 Jahr
14.386
+1.211
9.19%
1 Jan 2003 Jahr
15.948
+1.562
10.86%
1 Jan 2004 Jahr
18.318
+2.371
14.87%
1 Jan 2005 Jahr
14.585
-3.733
-20.38%
1 Jan 2006 Jahr
15.364
+0.778
5.34%
1 Jan 2007 Jahr
14.51
-0.854
-5.56%
1 Jan 2008 Jahr
14.613
+0.104
0.72%
1 Jan 2009 Jahr
10.598
-4.015
-27.48%
1 Jan 2010 Jahr
10.682
+0.084
0.79%
1 Jan 2011 Jahr
13.636
+2.954
27.65%
1 Jan 2012 Jahr
17.795
+4.16
30.51%
1 Jan 2013 Jahr
15.645
-2.15
-12.08%
1 Jan 2014 Jahr
17.196
+1.551
9.91%
1 Jan 2015 Jahr
15.952
-1.244
-7.23%
1 Jan 2016 Jahr
14.02
-1.933
-12.11%
Bewertung der Länder gemäß mit laufender Statistik nach Jahren


Kommentare: