29
/de/
de
AIzaSyAYiBZKx7MnpbEhh9jyipgxe19OcubqV5w
April 1, 2024
183421
Macao SAR, China
MAC
true
2
1
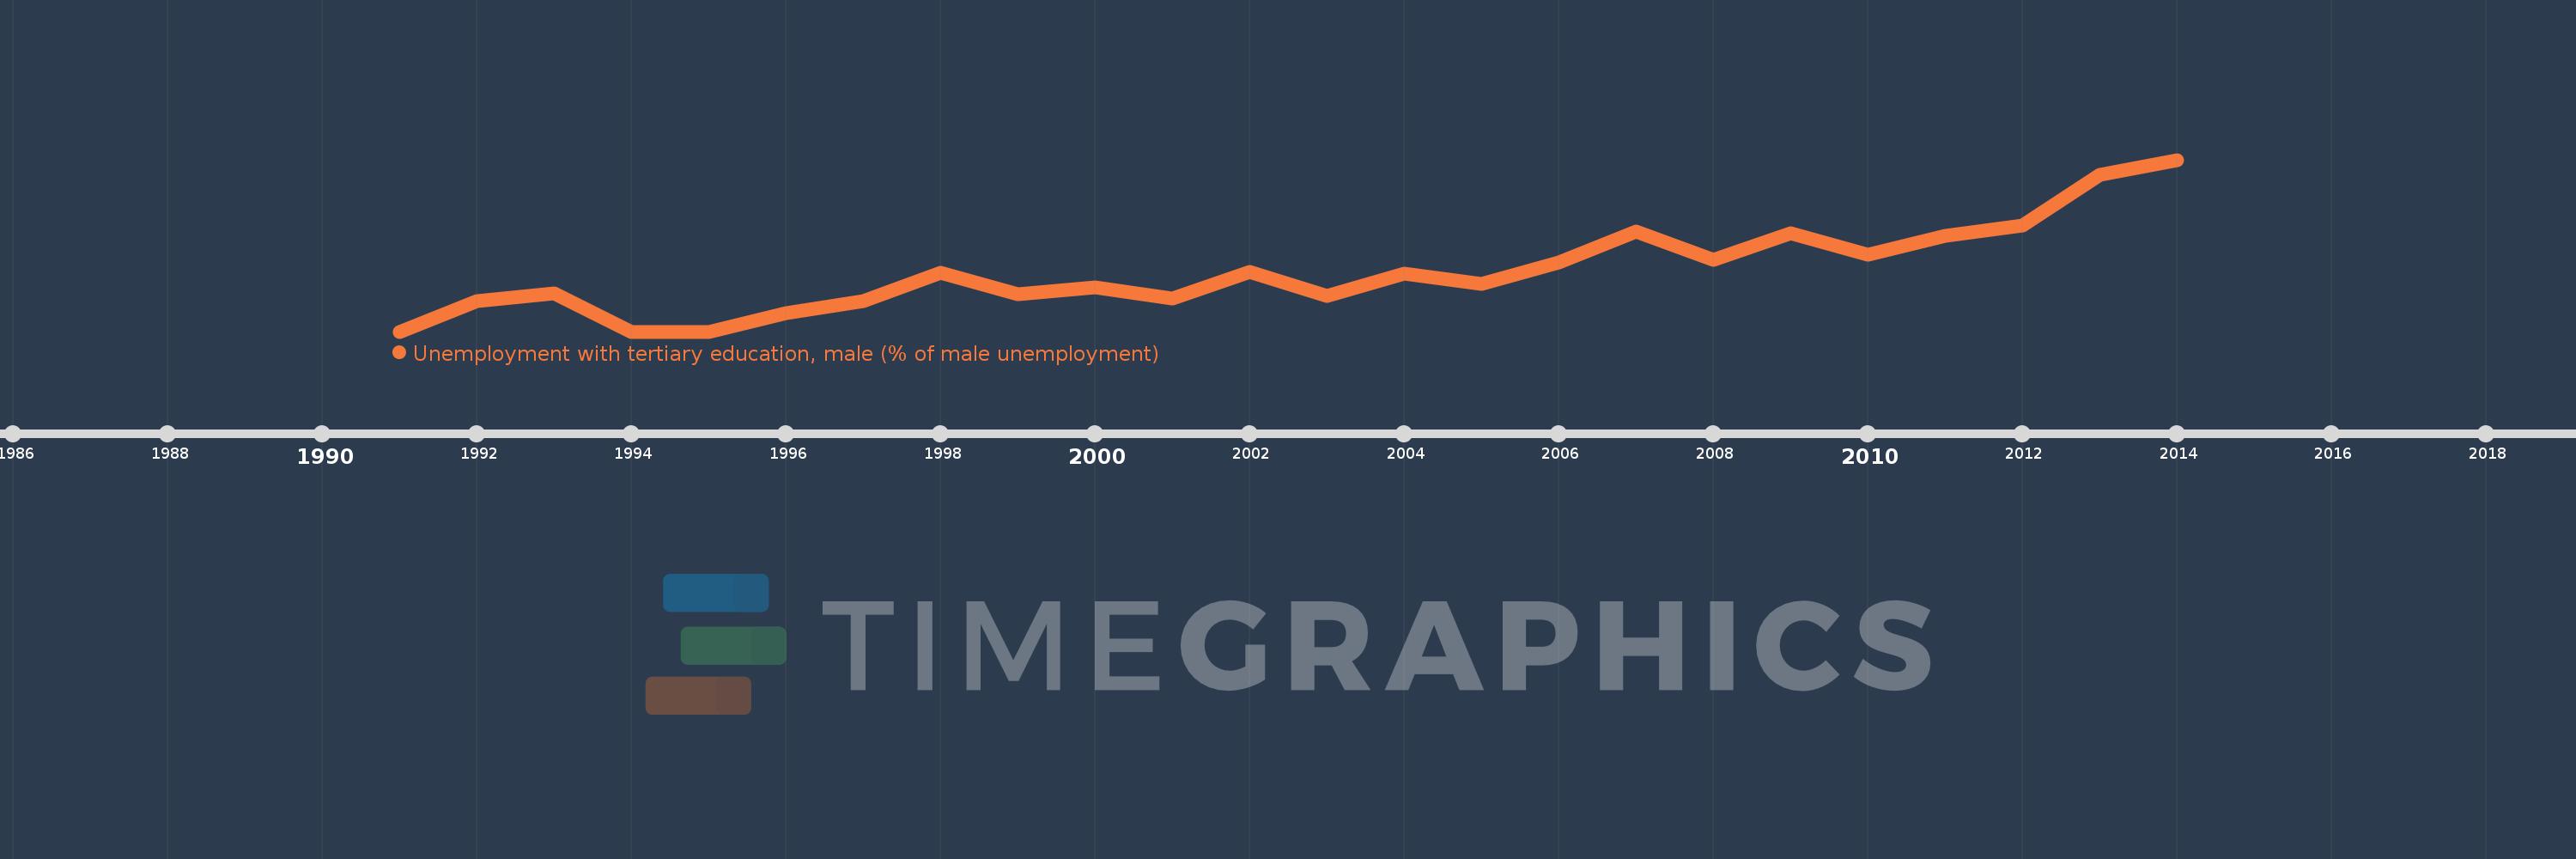
Unemployment with tertiary education, male (% of male unemployment)
2014,2013,2012,2011,2010,2009,2008,2007,2006,2005,2004,2003,2002,2001,2000,1999,1998,1997,1996,1995,1994,1993,1992,1991
Diese Statistik in anderen Ländern:
Zeitlinie:
Diese Zeitleiste vorliegt die Graphik ab 1991 J. bis 2014 J. Macao SAR, China. Die Angaben bis 1990 J. sind nicht vorhanden. Die Zahl aktueller Beobachtungen nach Daten: 24.
Die Quelle (Bezeichnung):
Kennzahlen der Weltentwicklung
Die Quelle (Einrichtung):
International Labour Organization, Key Indicators of the Labour Market database.
Kategorien:
Social Protection & Labor, Gender
Es wurde aktualisiert:
23 Apr 2017 Jahr
Kennzahlen der Wertänderungen vom Jahr zum Jahr
Minimum:
0.0
1 Jan 1991 Jahr
Maximum:
21.4
1 Jan 2014 Jahr
Zum Datum der Beobachtung
Wert
Absolute Veränderung
Die Veränderung bezüglich dem vorherigen Wert
1 Jan 1991 Jahr
0.0
0.0
0.0%
1 Jan 1992 Jahr
3.8
+3.8
%
1 Jan 1993 Jahr
4.8
+1.0
26.32%
1 Jan 1994 Jahr
0.0
-4.8
-100.0%
1 Jan 1996 Jahr
2.3
+2.3
%
1 Jan 1997 Jahr
3.8
+1.5
65.22%
1 Jan 1998 Jahr
7.3
+3.5
92.11%
1 Jan 1999 Jahr
4.7
-2.6
-35.62%
1 Jan 2000 Jahr
5.5
+0.8
17.02%
1 Jan 2001 Jahr
4.1
-1.4
-25.45%
1 Jan 2002 Jahr
7.4
+3.3
80.49%
1 Jan 2003 Jahr
4.4
-3.0
-40.54%
1 Jan 2004 Jahr
7.2
+2.8
63.64%
1 Jan 2005 Jahr
5.9
-1.3
-18.06%
1 Jan 2006 Jahr
8.6
+2.7
45.76%
1 Jan 2007 Jahr
12.5
+3.9
45.35%
1 Jan 2008 Jahr
8.9
-3.6
-28.8%
1 Jan 2009 Jahr
12.3
+3.4
38.2%
1 Jan 2010 Jahr
9.6
-2.7
-21.95%
1 Jan 2011 Jahr
11.9
+2.3
23.96%
1 Jan 2012 Jahr
13.2
+1.3
10.92%
1 Jan 2013 Jahr
19.5
+6.3
47.73%
1 Jan 2014 Jahr
21.4
+1.9
9.74%
Bewertung der Länder gemäß mit laufender Statistik nach Jahren


Kommentare: