29
/de/
de
AIzaSyAYiBZKx7MnpbEhh9jyipgxe19OcubqV5w
April 1, 2024
177290
Lesotho
LSO
true
2
1
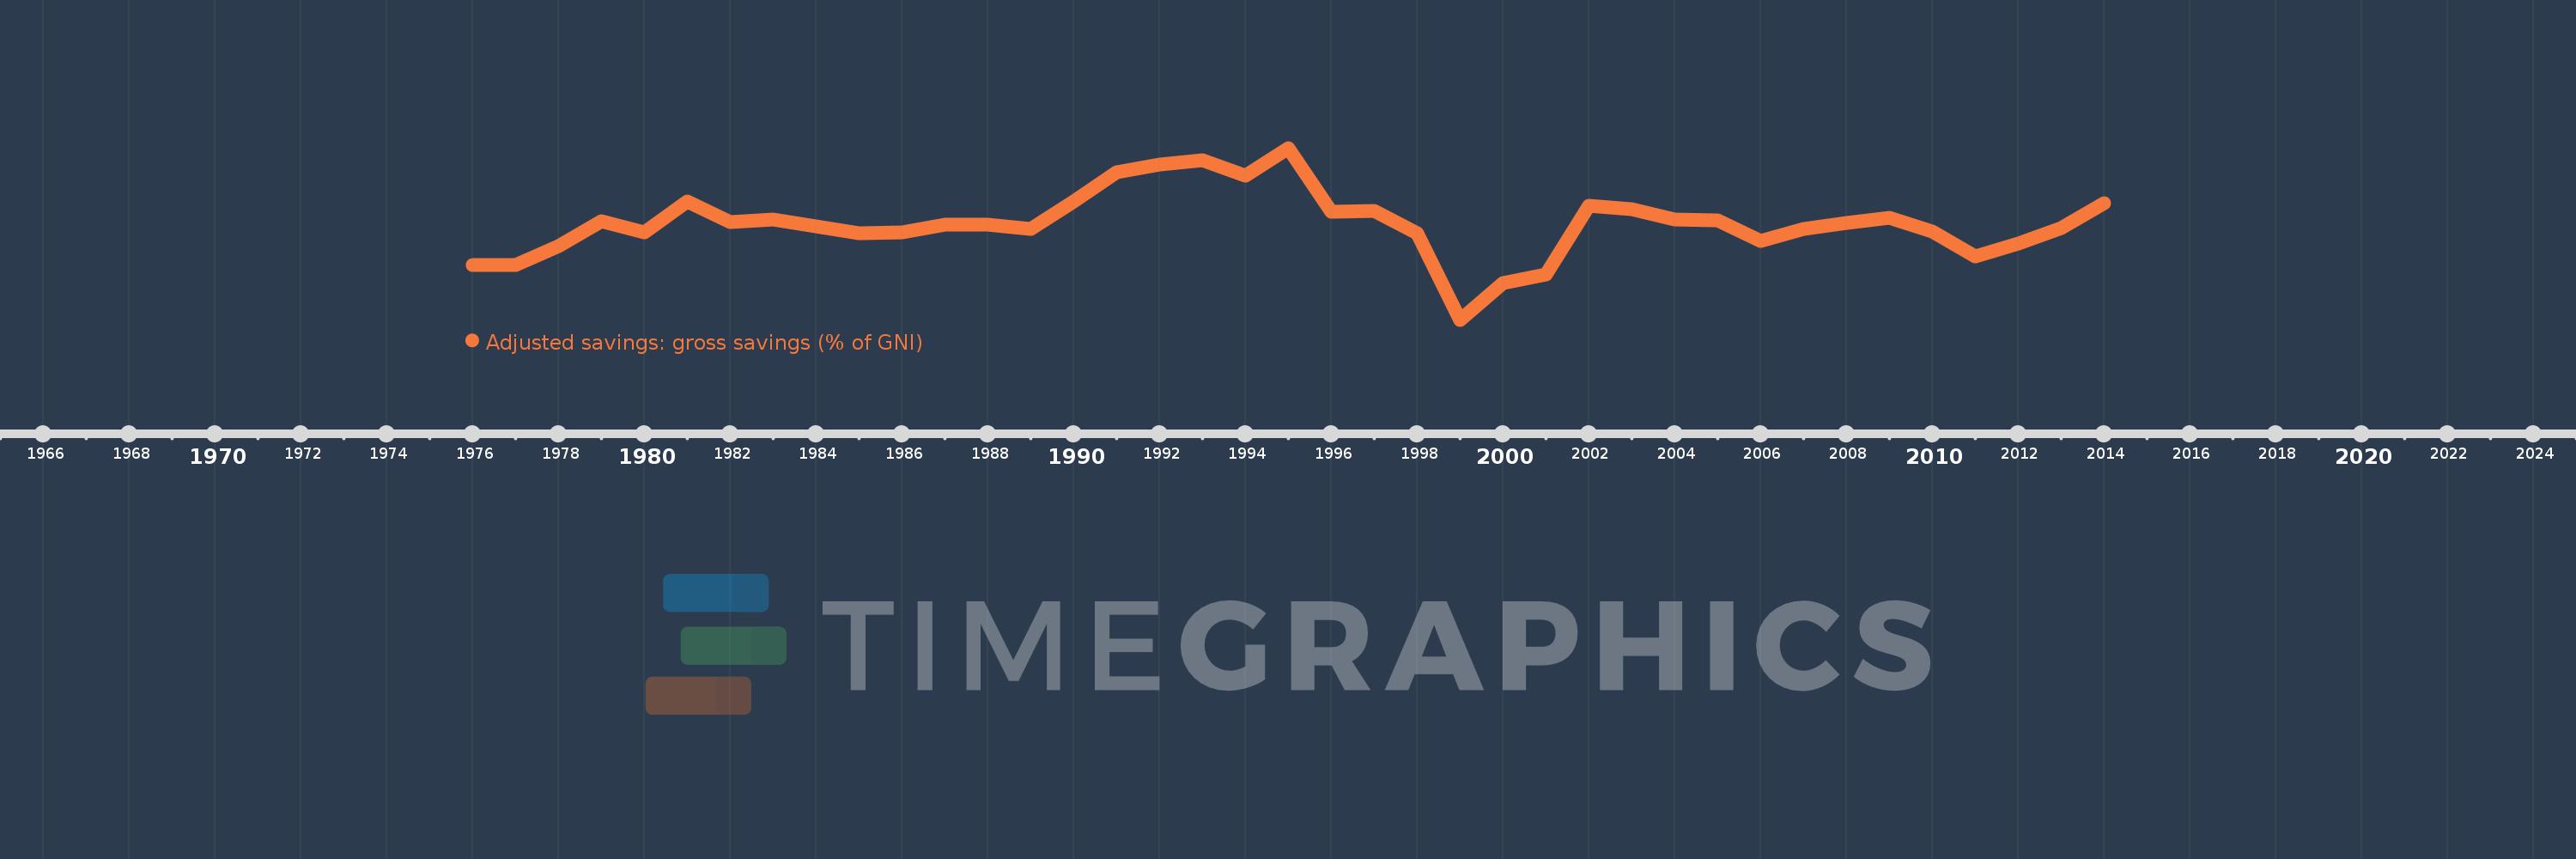
Adjusted savings: gross savings (% of GNI)
2014,2013,2012,2011,2010,2009,2008,2007,2006,2005,2004,2003,2002,2001,2000,1999,1998,1997,1996,1995,1994,1993,1992,1991,1990,1989,1988,1987,1986,1985,1984,1983,1982,1981,1980,1979,1978,1977,1976
Diese Statistik in anderen Ländern:
AfghanistanAlbaniaAlgeriaAngolaAntigua and BarbudaArab WorldArgentinaArmeniaAustraliaAustriaAzerbaijanBahamas, TheBahrainBangladeshBarbadosBelarusBelgiumBelizeBeninBermudaBhutanBoliviaBosnia and HerzegovinaBotswanaBrazilBrunei DarussalamBulgariaBurkina FasoBurundiCabo VerdeCambodiaCameroonCanadaCaribbean small statesCentral African RepublicCentral Europe and the BalticsChadChileChinaColombiaComorosCongo, Dem. Rep.Congo, Rep.Costa RicaCote d'IvoireCroatiaCyprusCzech RepublicDenmarkDjiboutiDominicaDominican RepublicEarly-demographic dividendEast Asia & PacificEast Asia & Pacific (excluding high income)East Asia & Pacific (IDA & IBRD countries)EcuadorEgypt, Arab Rep.El SalvadorEquatorial GuineaEritreaEstoniaEthiopiaEuro areaEurope & Central AsiaEurope & Central Asia (excluding high income)Europe & Central Asia (IDA & IBRD countries)European UnionFaroe IslandsFijiFinlandFragile and conflict affected situationsFranceGabonGambia, TheGeorgiaGermanyGhanaGreeceGrenadaGuatemalaGuineaGuinea-BissauGuyanaHaitiHeavily indebted poor countries (HIPC)High incomeHondurasHong Kong SAR, ChinaHungaryIBRD onlyIcelandIDA & IBRD totalIDA blendIDA onlyIDA totalIndiaIndonesiaIran, Islamic Rep.IraqIrelandIsraelItalyJamaicaJapanJordanKazakhstanKenyaKiribatiKorea, Rep.KosovoKuwaitKyrgyz RepublicLao PDRLate-demographic dividendLatin America & Caribbean Latin America & Caribbean (excluding high income)Latin America & the Caribbean (IDA & IBRD countries)LatviaLeast developed countries: UN classificationLebanonLesothoLiberiaLibyaLithuaniaLow & middle incomeLow incomeLower middle incomeLuxembourgMacao SAR, ChinaMacedonia, FYRMadagascarMalawiMalaysiaMaldivesMaliMaltaMauritaniaMauritiusMexicoMiddle East & North AfricaMiddle East & North Africa (excluding high income)Middle East & North Africa (IDA & IBRD countries)Middle incomeMoldovaMongoliaMontenegroMoroccoMozambiqueNamibiaNepalNetherlandsNew ZealandNicaraguaNigerNigeriaNorth AmericaNorwayOECD membersOmanOther small statesPacific island small statesPakistanPanamaPapua New GuineaParaguayPeruPhilippinesPolandPortugalPost-demographic dividendPre-demographic dividendQatarRomaniaRussian FederationRwandaSaudi ArabiaSenegalSerbiaSeychellesSierra LeoneSingaporeSlovak RepublicSloveniaSmall statesSolomon IslandsSouth AfricaSouth AsiaSouth Asia (IDA & IBRD)SpainSri LankaSt. Kitts and NevisSt. LuciaSt. Vincent and the GrenadinesSub-Saharan Africa Sub-Saharan Africa (excluding high income)Sub-Saharan Africa (IDA & IBRD countries)SudanSurinameSwazilandSwedenSwitzerlandSyrian Arab RepublicTajikistanTanzaniaThailandTimor-LesteTogoTongaTrinidad and TobagoTunisiaTurkeyTurkmenistanUgandaUkraineUnited KingdomUnited StatesUpper middle incomeUruguayVanuatuVenezuela, RBVietnamWest Bank and GazaWorldYemen, Rep.ZambiaZimbabwe Zeitlinie:
Diese Zeitleiste vorliegt die Graphik ab 1976 J. bis 2014 J. Lesotho. Die Angaben bis 1975 J. sind nicht vorhanden. Die Zahl aktueller Beobachtungen nach Daten: 39.
Die Quelle (Bezeichnung):
Kennzahlen der Weltentwicklung
Die Quelle (Einrichtung):
World Bank national accounts data files.
Kategorien:
Economy & Growth, Environment
Es wurde aktualisiert:
23 Apr 2017 Jahr
Kennzahlen der Wertänderungen vom Jahr zum Jahr
Minimum:
-14.482
1 Jan 1999 Jahr
Maximum:
51.292
1 Jan 1995 Jahr
Zum Datum der Beobachtung
Wert
Absolute Veränderung
Die Veränderung bezüglich dem vorherigen Wert
1 Jan 1976 Jahr
6.326
+6.326
0.0%
1 Jan 1977 Jahr
6.509
+0.183
2.89%
1 Jan 1978 Jahr
13.586
+7.077
108.73%
1 Jan 1979 Jahr
23.163
+9.577
70.5%
1 Jan 1980 Jahr
18.811
-4.352
-18.79%
1 Jan 1981 Jahr
30.783
+11.971
63.64%
1 Jan 1982 Jahr
22.79
-7.993
-25.96%
1 Jan 1983 Jahr
24.05
+1.26
5.53%
1 Jan 1984 Jahr
21.401
-2.65
-11.02%
1 Jan 1985 Jahr
18.682
-2.719
-12.7%
1 Jan 1986 Jahr
19.018
+0.336
1.8%
1 Jan 1987 Jahr
21.835
+2.817
14.81%
1 Jan 1988 Jahr
21.774
-0.061
-0.28%
1 Jan 1989 Jahr
20.235
-1.539
-7.07%
1 Jan 1990 Jahr
30.646
+10.411
51.45%
1 Jan 1991 Jahr
42.11
+11.464
37.41%
1 Jan 1992 Jahr
44.946
+2.835
6.73%
1 Jan 1993 Jahr
46.48
+1.534
3.41%
1 Jan 1994 Jahr
40.742
-5.738
-12.35%
1 Jan 1995 Jahr
51.292
+10.551
25.9%
1 Jan 1996 Jahr
26.787
-24.506
-47.78%
1 Jan 1997 Jahr
27.306
+0.52
1.94%
1 Jan 1998 Jahr
18.799
-8.507
-31.16%
1 Jan 1999 Jahr
-14.482
-33.281
-177.04%
1 Jan 2000 Jahr
-0.345
+14.137
-97.62%
1 Jan 2001 Jahr
2.811
+3.156
-914.23%
1 Jan 2002 Jahr
29.053
+26.242
933.57%
1 Jan 2003 Jahr
27.86
-1.193
-4.11%
1 Jan 2004 Jahr
23.998
-3.862
-13.86%
1 Jan 2005 Jahr
23.658
-0.34
-1.42%
1 Jan 2006 Jahr
15.691
-7.967
-33.68%
1 Jan 2007 Jahr
20.264
+4.573
29.14%
1 Jan 2008 Jahr
22.492
+2.228
11.0%
1 Jan 2009 Jahr
24.463
+1.971
8.76%
1 Jan 2010 Jahr
19.276
-5.187
-21.2%
1 Jan 2011 Jahr
9.649
-9.627
-49.94%
1 Jan 2012 Jahr
14.608
+4.959
51.39%
1 Jan 2013 Jahr
20.727
+6.12
41.89%
1 Jan 2014 Jahr
30.281
+9.554
46.09%
Bewertung der Länder gemäß mit laufender Statistik nach Jahren


Kommentare: