29
/de/
de
AIzaSyAYiBZKx7MnpbEhh9jyipgxe19OcubqV5w
April 1, 2024
176678
Lebanon
LBN
true
2
1
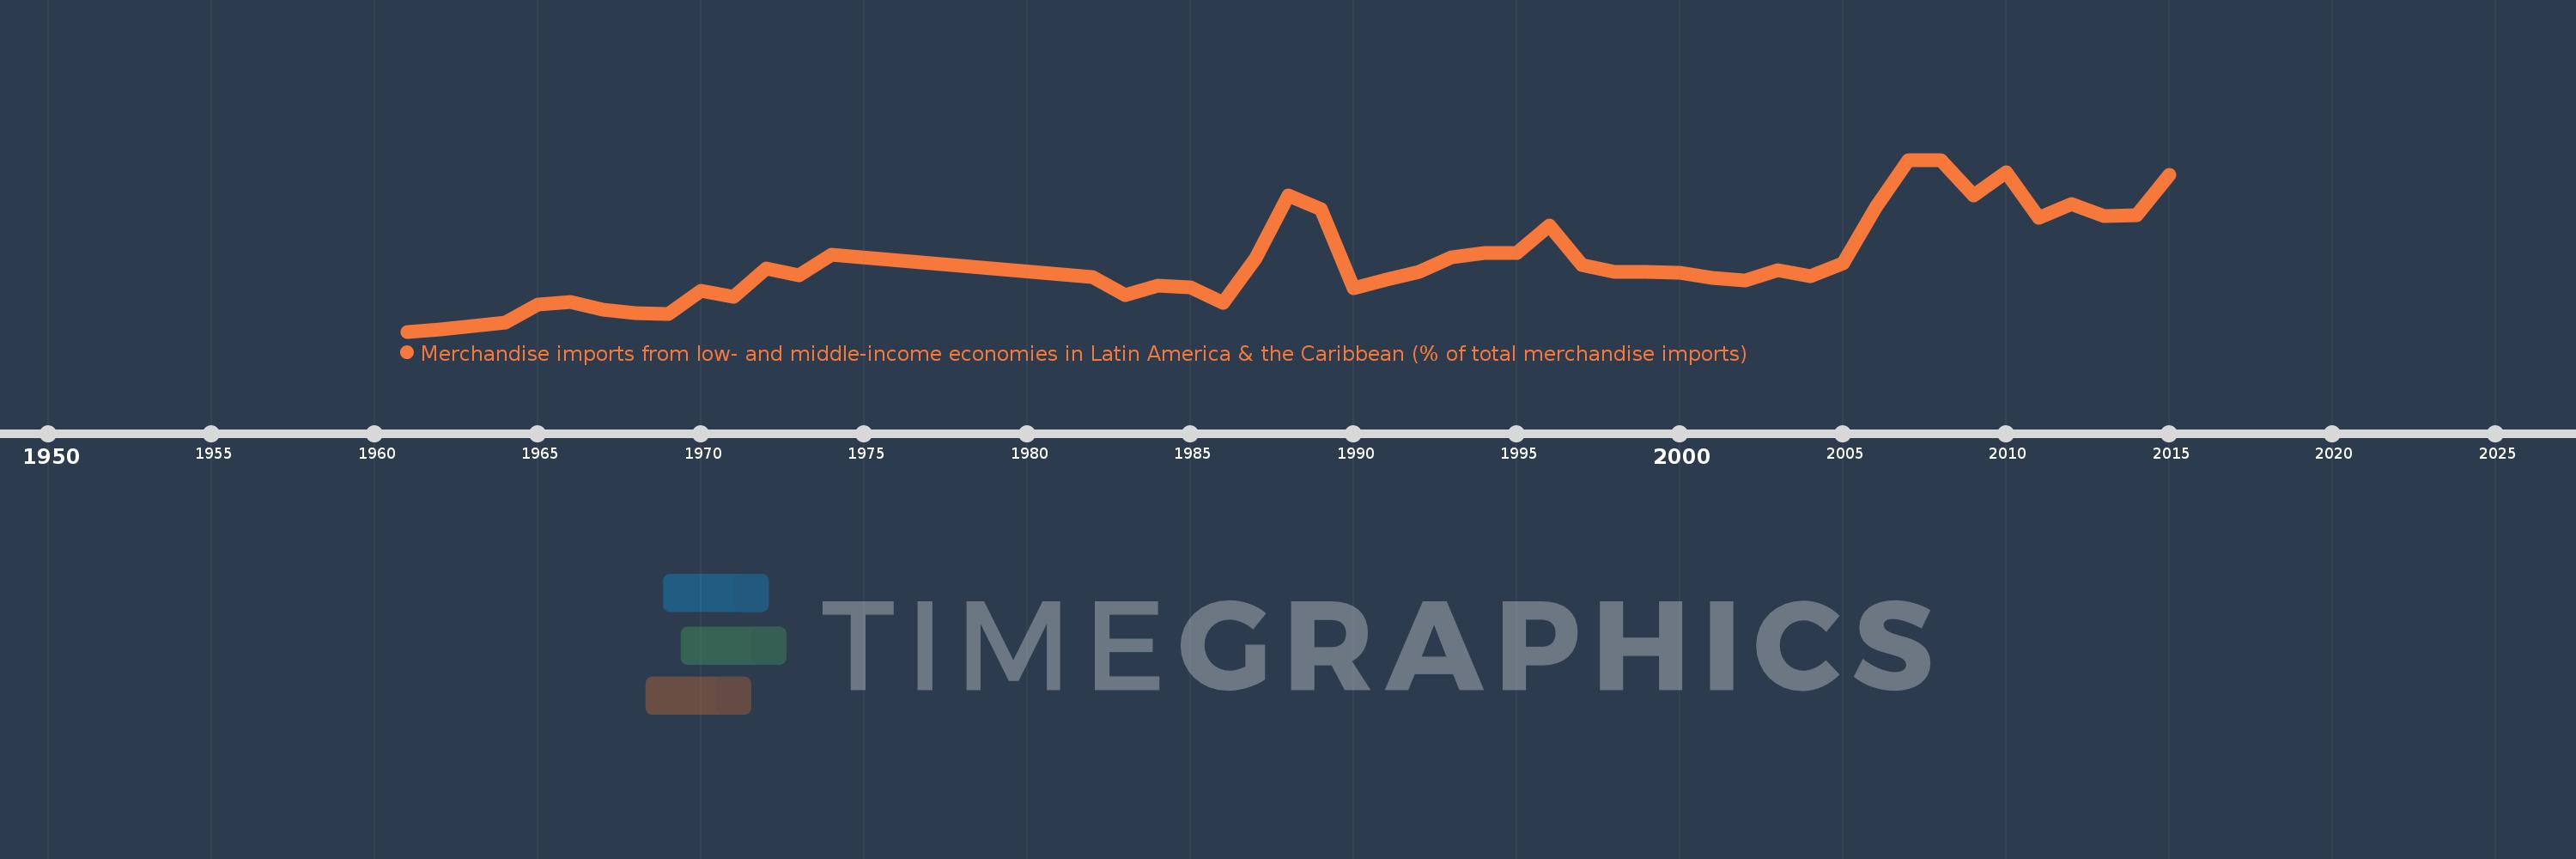
Merchandise imports from low- and middle-income economies in Latin America & the Caribbean (% of total merchandise imports)
2015,2014,2013,2012,2011,2010,2009,2008,2007,2006,2005,2004,2003,2002,2001,2000,1999,1998,1997,1996,1995,1994,1993,1992,1991,1990,1989,1988,1987,1986,1985,1984,1983,1982,1974,1973,1972,1971,1970,1969,1968,1967,1966,1965,1964,1962,1961
Diese Statistik in anderen Ländern:
AfghanistanAlbaniaAlgeriaAngolaAntigua and BarbudaArab WorldArgentinaArmeniaArubaAustraliaAustriaAzerbaijanBahamas, TheBahrainBangladeshBarbadosBelarusBelgiumBelizeBeninBermudaBoliviaBrazilBrunei DarussalamBulgariaBurkina FasoCabo VerdeCambodiaCameroonCanadaCaribbean small statesCentral African RepublicCentral Europe and the BalticsChileChinaColombiaCongo, Dem. Rep.Congo, Rep.Costa RicaCote d'IvoireCroatiaCubaCyprusCzech RepublicDenmarkDominicaDominican RepublicEarly-demographic dividendEast Asia & PacificEast Asia & Pacific (excluding high income)East Asia & Pacific (IDA & IBRD countries)EcuadorEgypt, Arab Rep.El SalvadorEstoniaEthiopiaEuro areaEurope & Central AsiaEurope & Central Asia (excluding high income)Europe & Central Asia (IDA & IBRD countries)European UnionFaroe IslandsFijiFinlandFragile and conflict affected situationsFranceFrench PolynesiaGabonGambia, TheGeorgiaGermanyGhanaGibraltarGreeceGreenlandGrenadaGuatemalaGuineaGuyanaHaitiHeavily indebted poor countries (HIPC)High incomeHondurasHong Kong SAR, ChinaHungaryIBRD onlyIcelandIDA & IBRD totalIDA blendIDA onlyIDA totalIndiaIndonesiaIran, Islamic Rep.IraqIrelandIsraelItalyJamaicaJapanJordanKazakhstanKenyaKorea, Dem. People’s Rep.Korea, Rep.KuwaitKyrgyz RepublicLate-demographic dividendLatin America & Caribbean Latin America & Caribbean (excluding high income)Latin America & the Caribbean (IDA & IBRD countries)LatviaLeast developed countries: UN classificationLebanonLiberiaLibyaLithuaniaLow & middle incomeLow incomeLower middle incomeLuxembourgMacao SAR, ChinaMacedonia, FYRMadagascarMalawiMalaysiaMaldivesMaliMaltaMauritaniaMauritiusMexicoMiddle East & North AfricaMiddle East & North Africa (excluding high income)Middle East & North Africa (IDA & IBRD countries)Middle incomeMoldovaMongoliaMontenegroMoroccoMozambiqueNetherlandsNew CaledoniaNew ZealandNicaraguaNigerNigeriaNorth AmericaNorwayOECD membersOmanOther small statesPacific island small statesPakistanPanamaPapua New GuineaParaguayPeruPhilippinesPolandPortugalPost-demographic dividendPre-demographic dividendQatarRomaniaRussian FederationSaudi ArabiaSenegalSerbiaSierra LeoneSingaporeSlovak RepublicSloveniaSmall statesSomaliaSouth AfricaSouth AsiaSouth Asia (IDA & IBRD)SpainSri LankaSt. Kitts and NevisSt. LuciaSt. Vincent and the GrenadinesSub-Saharan Africa Sub-Saharan Africa (excluding high income)Sub-Saharan Africa (IDA & IBRD countries)SudanSurinameSwedenSwitzerlandSyrian Arab RepublicTanzaniaThailandTogoTrinidad and TobagoTunisiaTurkeyUgandaUkraineUnited Arab EmiratesUnited KingdomUnited StatesUpper middle incomeUruguayVenezuela, RBVietnamWorldYemen, Rep.ZambiaZimbabwe Zeitlinie:
Diese Zeitleiste vorliegt die Graphik ab 1961 J. bis 2015 J. Lebanon. Die Angaben bis 1960 J. sind nicht vorhanden. Die Zahl aktueller Beobachtungen nach Daten: 47.
Die Quelle (Bezeichnung):
Kennzahlen der Weltentwicklung
Die Quelle (Einrichtung):
World Bank staff estimates based data from International Monetary Fund's Direction of Trade database.
Kategorien:
Private Sector, Trade
Es wurde aktualisiert:
23 Apr 2017 Jahr
Kennzahlen der Wertänderungen vom Jahr zum Jahr
Minimum:
0.418
1 Jan 1961 Jahr
Maximum:
2.75
1 Jan 2007 Jahr
Zum Datum der Beobachtung
Wert
Absolute Veränderung
Die Veränderung bezüglich dem vorherigen Wert
1 Jan 1961 Jahr
0.418
+0.418
0.0%
1 Jan 1962 Jahr
0.452
+0.034
8.02%
1 Jan 1964 Jahr
0.544
+0.092
20.46%
1 Jan 1965 Jahr
0.789
+0.245
45.11%
1 Jan 1966 Jahr
0.817
+0.027
3.48%
1 Jan 1967 Jahr
0.713
-0.103
-12.63%
1 Jan 1968 Jahr
0.669
-0.044
-6.2%
1 Jan 1969 Jahr
0.654
-0.015
-2.3%
1 Jan 1970 Jahr
0.975
+0.321
49.04%
1 Jan 1971 Jahr
0.885
-0.09
-9.23%
1 Jan 1972 Jahr
1.274
+0.39
44.05%
1 Jan 1973 Jahr
1.182
-0.093
-7.27%
1 Jan 1974 Jahr
1.467
+0.286
24.17%
1 Jan 1982 Jahr
1.162
-0.305
-20.8%
1 Jan 1983 Jahr
0.913
-0.249
-21.41%
1 Jan 1984 Jahr
1.044
+0.131
14.3%
1 Jan 1985 Jahr
1.019
-0.025
-2.39%
1 Jan 1986 Jahr
0.813
-0.206
-20.26%
1 Jan 1987 Jahr
1.416
+0.604
74.28%
1 Jan 1988 Jahr
2.267
+0.851
60.09%
1 Jan 1989 Jahr
2.084
-0.183
-8.07%
1 Jan 1990 Jahr
1.012
-1.072
-51.45%
1 Jan 1991 Jahr
1.122
+0.11
10.89%
1 Jan 1992 Jahr
1.234
+0.112
10.01%
1 Jan 1993 Jahr
1.424
+0.19
15.37%
1 Jan 1994 Jahr
1.48
+0.056
3.91%
1 Jan 1995 Jahr
1.483
+0.003
0.22%
1 Jan 1996 Jahr
1.854
+0.371
25.02%
1 Jan 1997 Jahr
1.32
-0.534
-28.79%
1 Jan 1998 Jahr
1.234
-0.086
-6.51%
1 Jan 1999 Jahr
1.227
-0.007
-0.58%
1 Jan 2000 Jahr
1.213
-0.014
-1.13%
1 Jan 2001 Jahr
1.147
-0.066
-5.45%
1 Jan 2002 Jahr
1.108
-0.039
-3.43%
1 Jan 2003 Jahr
1.251
+0.144
12.96%
1 Jan 2004 Jahr
1.172
-0.079
-6.34%
1 Jan 2005 Jahr
1.344
+0.172
14.64%
1 Jan 2006 Jahr
2.104
+0.76
56.57%
1 Jan 2007 Jahr
2.75
+0.647
30.74%
1 Jan 2008 Jahr
2.746
-0.004
-0.14%
1 Jan 2009 Jahr
2.262
-0.485
-17.65%
1 Jan 2010 Jahr
2.584
+0.322
14.25%
1 Jan 2011 Jahr
1.959
-0.625
-24.2%
1 Jan 2012 Jahr
2.144
+0.185
9.45%
1 Jan 2013 Jahr
1.984
-0.16
-7.45%
1 Jan 2014 Jahr
1.999
+0.015
0.73%
1 Jan 2015 Jahr
2.545
+0.546
27.34%
Bewertung der Länder gemäß mit laufender Statistik nach Jahren


Kommentare: