29
/de/
de
AIzaSyAYiBZKx7MnpbEhh9jyipgxe19OcubqV5w
April 1, 2024
176447
Lebanon
LBN
true
2
1
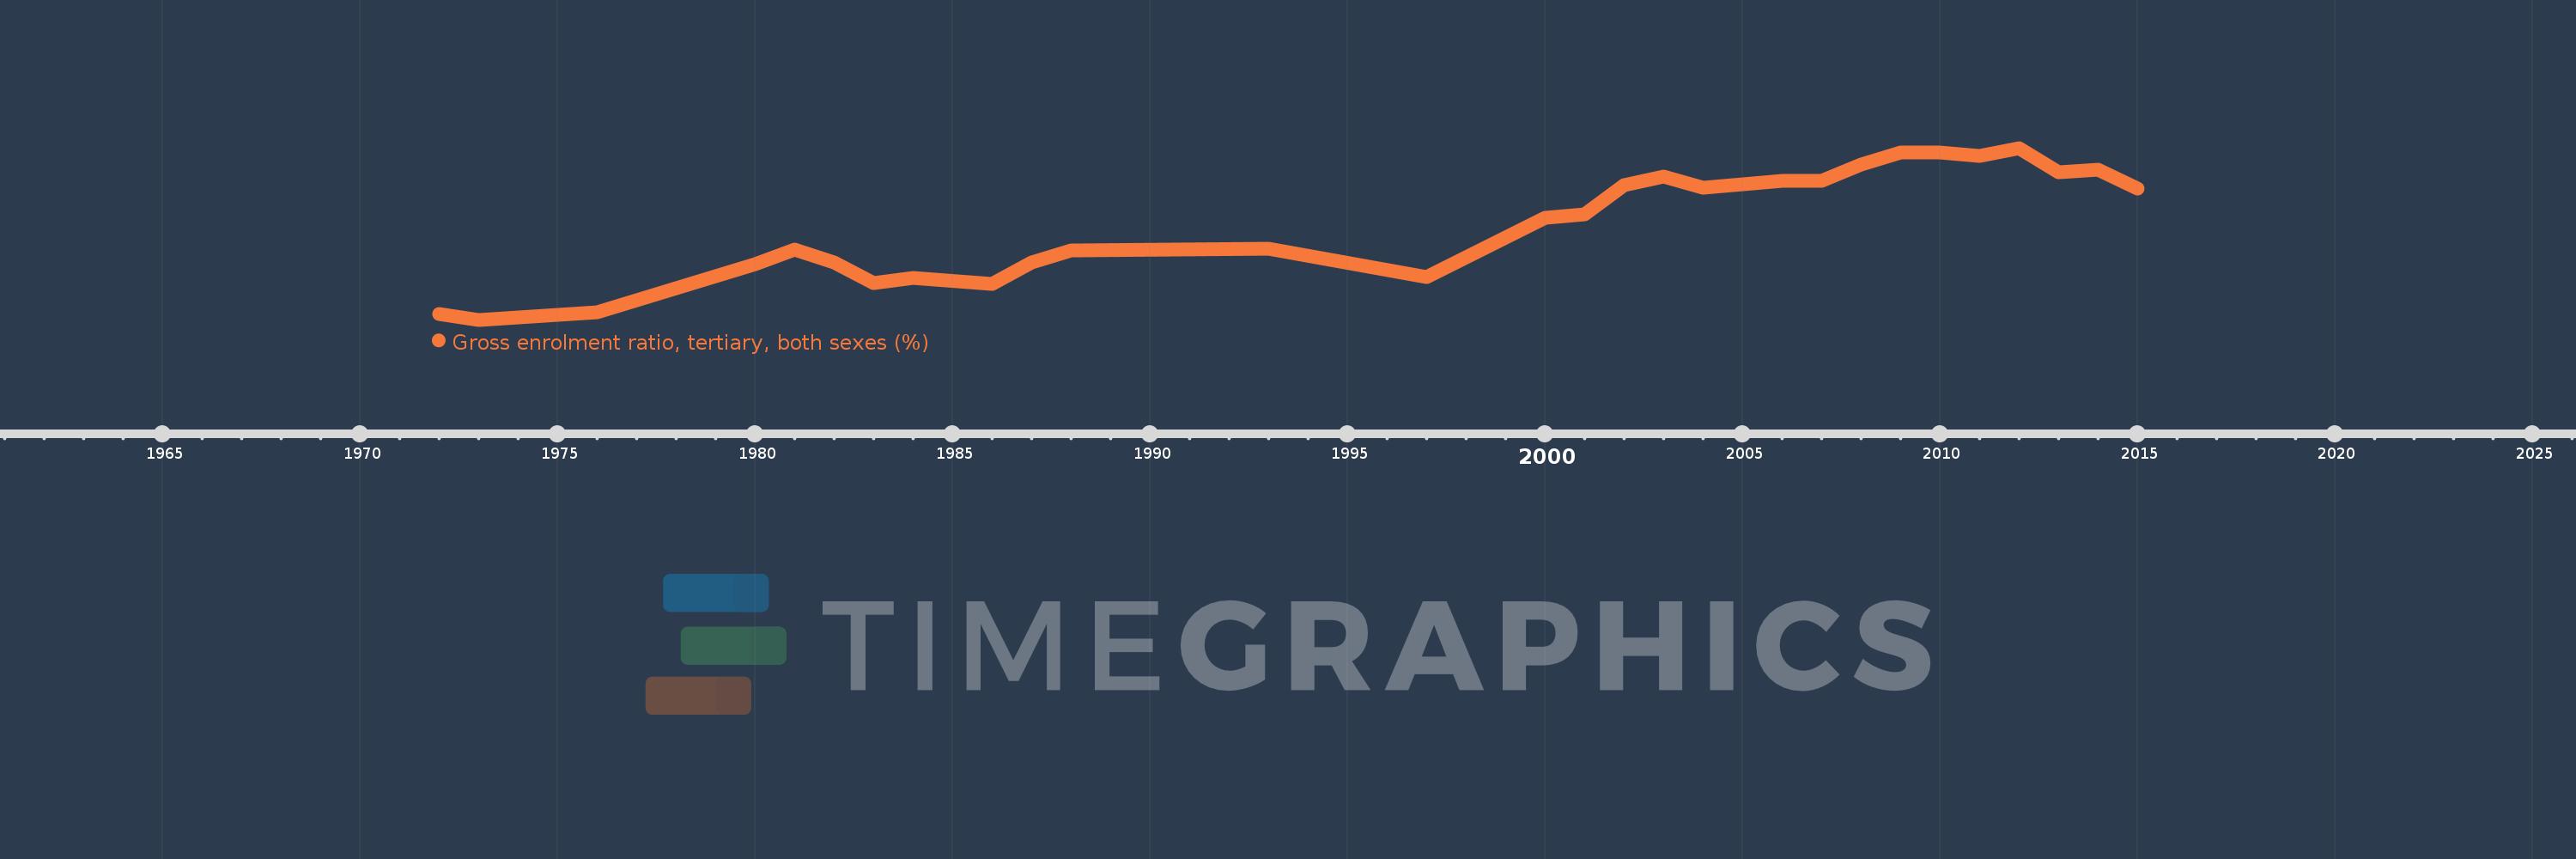
Gross enrolment ratio, tertiary, both sexes (%)
2015,2014,2013,2012,2011,2010,2009,2008,2007,2006,2005,2004,2003,2002,2001,2000,1997,1993,1988,1987,1986,1984,1983,1982,1981,1980,1976,1973,1972
Diese Statistik in anderen Ländern:
AfghanistanAlbaniaAlgeriaAngolaAntigua and BarbudaArab WorldArgentinaArmeniaArubaAustraliaAustriaAzerbaijanBahamas, TheBahrainBangladeshBarbadosBelarusBelgiumBelizeBeninBermudaBhutanBoliviaBosnia and HerzegovinaBotswanaBrazilBritish Virgin IslandsBrunei DarussalamBulgariaBurkina FasoBurundiCabo VerdeCambodiaCameroonCanadaCaribbean small statesCentral African RepublicCentral Europe and the BalticsChadChileChinaColombiaComorosCongo, Dem. Rep.Congo, Rep.Costa RicaCote d'IvoireCroatiaCubaCuracaoCyprusCzech RepublicDenmarkDjiboutiDominicaDominican RepublicEarly-demographic dividendEast Asia & PacificEast Asia & Pacific (excluding high income)East Asia & Pacific (IDA & IBRD countries)EcuadorEgypt, Arab Rep.El SalvadorEquatorial GuineaEritreaEstoniaEthiopiaEuro areaEurope & Central AsiaEurope & Central Asia (excluding high income)Europe & Central Asia (IDA & IBRD countries)European UnionFijiFinlandFragile and conflict affected situationsFranceGabonGambia, TheGeorgiaGermanyGhanaGreeceGrenadaGuatemalaGuineaGuinea-BissauGuyanaHaitiHeavily indebted poor countries (HIPC)High incomeHondurasHong Kong SAR, ChinaHungaryIBRD onlyIcelandIDA & IBRD totalIDA blendIDA onlyIDA totalIndiaIndonesiaIran, Islamic Rep.IraqIrelandIsraelItalyJamaicaJapanJordanKazakhstanKenyaKorea, Dem. People’s Rep.Korea, Rep.KuwaitKyrgyz RepublicLao PDRLate-demographic dividendLatin America & Caribbean Latin America & Caribbean (excluding high income)Latin America & the Caribbean (IDA & IBRD countries)LatviaLeast developed countries: UN classificationLebanonLesothoLiberiaLibyaLiechtensteinLithuaniaLow & middle incomeLow incomeLower middle incomeLuxembourgMacao SAR, ChinaMacedonia, FYRMadagascarMalawiMalaysiaMaldivesMaliMaltaMarshall IslandsMauritaniaMauritiusMexicoMicronesia, Fed. Sts.Middle East & North AfricaMiddle East & North Africa (excluding high income)Middle East & North Africa (IDA & IBRD countries)Middle incomeMoldovaMongoliaMontenegroMoroccoMozambiqueMyanmarNamibiaNepalNetherlandsNew ZealandNicaraguaNigerNigeriaNorth AmericaNorwayOECD membersOmanOther small statesPacific island small statesPakistanPalauPanamaPapua New GuineaParaguayPeruPhilippinesPolandPortugalPost-demographic dividendPre-demographic dividendPuerto RicoQatarRomaniaRussian FederationRwandaSamoaSan MarinoSao Tome and PrincipeSaudi ArabiaSenegalSerbiaSeychellesSierra LeoneSingaporeSlovak RepublicSloveniaSmall statesSomaliaSouth AfricaSouth AsiaSouth Asia (IDA & IBRD)SpainSri LankaSt. Kitts and NevisSt. LuciaSt. Vincent and the GrenadinesSub-Saharan Africa Sub-Saharan Africa (excluding high income)Sub-Saharan Africa (IDA & IBRD countries)SudanSurinameSwazilandSwedenSwitzerlandSyrian Arab RepublicTajikistanTanzaniaThailandTimor-LesteTogoTongaTrinidad and TobagoTunisiaTurkeyTurkmenistanUgandaUkraineUnited Arab EmiratesUnited KingdomUnited StatesUpper middle incomeUruguayUzbekistanVanuatuVenezuela, RBVietnamWest Bank and GazaWorldYemen, Rep.ZambiaZimbabwe Zeitlinie:
Diese Zeitleiste vorliegt die Graphik ab 1972 J. bis 2015 J. Lebanon. Die Angaben bis 1971 J. sind nicht vorhanden. Die Zahl aktueller Beobachtungen nach Daten: 29.
Die Quelle (Bezeichnung):
Kennzahlen der Weltentwicklung
Die Quelle (Einrichtung):
UNESCO Institute for Statistics
Kategorien:
Education
Es wurde aktualisiert:
23 Apr 2017 Jahr
Kennzahlen der Wertänderungen vom Jahr zum Jahr
Minimum:
20.147
1 Jan 1973 Jahr
Maximum:
49.738
1 Jan 2012 Jahr
Zum Datum der Beobachtung
Wert
Absolute Veränderung
Die Veränderung bezüglich dem vorherigen Wert
1 Jan 1972 Jahr
21.151
+21.151
0.0%
1 Jan 1973 Jahr
20.147
-1.004
-4.75%
1 Jan 1976 Jahr
21.451
+1.304
6.47%
1 Jan 1980 Jahr
29.653
+8.202
38.24%
1 Jan 1981 Jahr
32.285
+2.632
8.88%
1 Jan 1982 Jahr
29.955
-2.33
-7.22%
1 Jan 1983 Jahr
26.453
-3.502
-11.69%
1 Jan 1984 Jahr
27.304
+0.851
3.22%
1 Jan 1986 Jahr
26.348
-0.956
-3.5%
1 Jan 1987 Jahr
29.977
+3.629
13.77%
1 Jan 1988 Jahr
32.119
+2.141
7.14%
1 Jan 1993 Jahr
32.451
+0.333
1.04%
1 Jan 1997 Jahr
27.538
-4.913
-15.14%
1 Jan 2000 Jahr
37.669
+10.131
36.79%
1 Jan 2001 Jahr
38.306
+0.637
1.69%
1 Jan 2002 Jahr
43.401
+5.095
13.3%
1 Jan 2003 Jahr
44.839
+1.438
3.31%
1 Jan 2004 Jahr
42.948
-1.892
-4.22%
1 Jan 2005 Jahr
43.489
+0.542
1.26%
1 Jan 2006 Jahr
44.123
+0.634
1.46%
1 Jan 2007 Jahr
44.1
-0.023
-0.05%
1 Jan 2008 Jahr
46.918
+2.818
6.39%
1 Jan 2009 Jahr
48.881
+1.963
4.18%
1 Jan 2010 Jahr
48.994
+0.113
0.23%
1 Jan 2011 Jahr
48.412
-0.582
-1.19%
1 Jan 2012 Jahr
49.738
+1.326
2.74%
1 Jan 2013 Jahr
45.579
-4.159
-8.36%
1 Jan 2014 Jahr
45.946
+0.367
0.81%
1 Jan 2015 Jahr
42.773
-3.173
-6.91%
Bewertung der Länder gemäß mit laufender Statistik nach Jahren


Kommentare: