29
/de/
de
AIzaSyAYiBZKx7MnpbEhh9jyipgxe19OcubqV5w
April 1, 2024
164771
Jordan
JOR
true
2
1
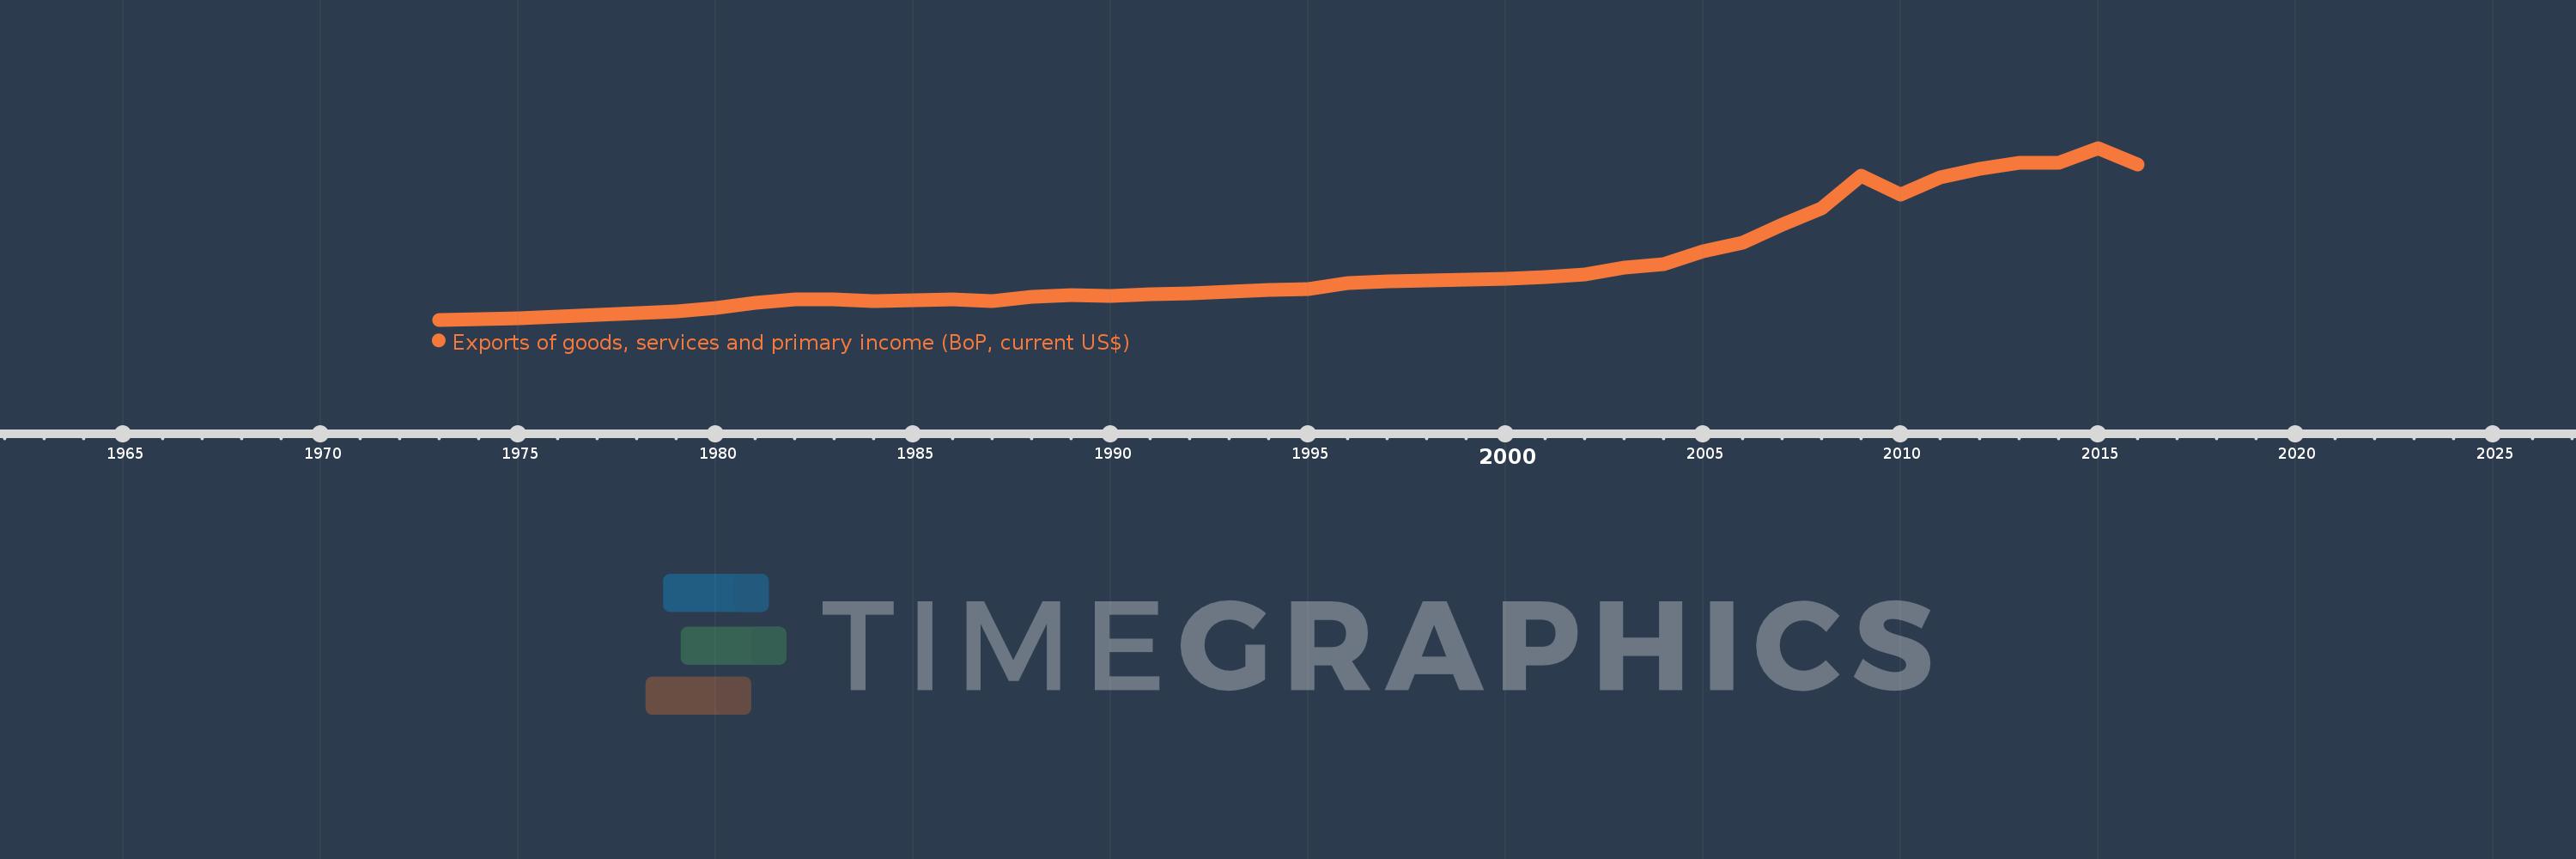
Exports of goods, services and primary income (BoP, current US$)
2016,2015,2014,2013,2012,2011,2010,2009,2008,2007,2006,2005,2004,2003,2002,2001,2000,1999,1998,1997,1996,1995,1994,1993,1992,1991,1990,1989,1988,1987,1986,1985,1984,1983,1982,1981,1980,1979,1978,1977,1976,1975,1974,1973
Diese Statistik in anderen Ländern:
AfghanistanAlbaniaAlgeriaAngolaAntigua and BarbudaArab WorldArgentinaArmeniaArubaAustraliaAustriaAzerbaijanBahamas, TheBahrainBangladeshBarbadosBelarusBelgiumBelizeBeninBermudaBhutanBoliviaBosnia and HerzegovinaBotswanaBrazilBrunei DarussalamBulgariaBurkina FasoBurundiCabo VerdeCambodiaCameroonCanadaCaribbean small statesCentral African RepublicCentral Europe and the BalticsChadChileChinaColombiaComorosCongo, Dem. Rep.Congo, Rep.Costa RicaCote d'IvoireCroatiaCuracaoCyprusCzech RepublicDenmarkDjiboutiDominicaDominican RepublicEarly-demographic dividendEast Asia & PacificEast Asia & Pacific (excluding high income)East Asia & Pacific (IDA & IBRD countries)EcuadorEgypt, Arab Rep.El SalvadorEquatorial GuineaEritreaEstoniaEthiopiaEuro areaEurope & Central AsiaEurope & Central Asia (excluding high income)Europe & Central Asia (IDA & IBRD countries)European UnionFaroe IslandsFijiFinlandFragile and conflict affected situationsFranceFrench PolynesiaGabonGambia, TheGeorgiaGermanyGhanaGreeceGrenadaGuatemalaGuineaGuinea-BissauGuyanaHaitiHeavily indebted poor countries (HIPC)High incomeHondurasHong Kong SAR, ChinaHungaryIBRD onlyIcelandIDA & IBRD totalIDA blendIDA onlyIDA totalIndiaIndonesiaIran, Islamic Rep.IraqIrelandIsraelItalyJamaicaJapanJordanKazakhstanKenyaKiribatiKorea, Rep.KosovoKuwaitKyrgyz RepublicLao PDRLate-demographic dividendLatin America & Caribbean Latin America & Caribbean (excluding high income)Latin America & the Caribbean (IDA & IBRD countries)LatviaLeast developed countries: UN classificationLebanonLesothoLiberiaLibyaLithuaniaLow & middle incomeLow incomeLower middle incomeLuxembourgMacao SAR, ChinaMacedonia, FYRMadagascarMalawiMalaysiaMaldivesMaliMaltaMarshall IslandsMauritaniaMauritiusMexicoMicronesia, Fed. Sts.Middle East & North Africa (excluding high income)Middle East & North Africa (IDA & IBRD countries)Middle incomeMoldovaMongoliaMontenegroMoroccoMozambiqueMyanmarNamibiaNepalNetherlandsNew CaledoniaNicaraguaNigerNigeriaNorth AmericaNorwayOECD membersOmanPacific island small statesPakistanPalauPanamaPapua New GuineaParaguayPeruPhilippinesPolandPortugalPost-demographic dividendPre-demographic dividendQatarRomaniaRussian FederationRwandaSamoaSao Tome and PrincipeSaudi ArabiaSenegalSerbiaSeychellesSierra LeoneSingaporeSint Maarten (Dutch part)Slovak RepublicSloveniaSolomon IslandsSouth AfricaSouth AsiaSouth Asia (IDA & IBRD)South SudanSpainSri LankaSt. Kitts and NevisSt. LuciaSt. Vincent and the GrenadinesSub-Saharan Africa Sub-Saharan Africa (excluding high income)Sub-Saharan Africa (IDA & IBRD countries)SudanSurinameSwazilandSwedenSwitzerlandSyrian Arab RepublicTajikistanTanzaniaThailandTimor-LesteTogoTongaTrinidad and TobagoTunisiaTurkeyTuvaluUgandaUkraineUnited KingdomUnited StatesUpper middle incomeUruguayVanuatuVenezuela, RBVietnamWest Bank and GazaWorldYemen, Rep.ZambiaZimbabwe Zeitlinie:
Diese Zeitleiste vorliegt die Graphik ab 1973 J. bis 2016 J. Jordan. Die Angaben bis 1972 J. sind nicht vorhanden. Die Zahl aktueller Beobachtungen nach Daten: 44.
Die Quelle (Bezeichnung):
Kennzahlen der Weltentwicklung
Die Quelle (Einrichtung):
International Monetary Fund, Balance of Payments Statistics Yearbook and data files.
Kategorien:
Economy & Growth, External Debt, Trade
Es wurde aktualisiert:
23 Apr 2017 Jahr
Kennzahlen der Wertänderungen vom Jahr zum Jahr
im Durchschnitt:
5.146 Mlrd.
Minimum:
124.88 Mln.
1 Jan 1973 Jahr
Maximum:
16.405 Mlrd.
1 Jan 2015 Jahr
Zum Datum der Beobachtung
Wert
Absolute Veränderung
Die Veränderung bezüglich dem vorherigen Wert
1 Jan 1973 Jahr
124.88 Mln.
+124.88 Mln.
0.0%
1 Jan 1974 Jahr
189.0 Mln.
+64.12 Mln.
51.35%
1 Jan 1975 Jahr
279.734 Mln.
+90.734 Mln.
48.01%
1 Jan 1976 Jahr
414.645 Mln.
+134.911 Mln.
48.23%
1 Jan 1977 Jahr
590.391 Mln.
+175.746 Mln.
42.38%
1 Jan 1978 Jahr
731.836 Mln.
+141.445 Mln.
23.96%
1 Jan 1979 Jahr
921.253 Mln.
+189.417 Mln.
25.88%
1 Jan 1980 Jahr
1.222 Mlrd.
+300.381 Mln.
32.61%
1 Jan 1981 Jahr
1.704 Mlrd.
+482.552 Mln.
39.5%
1 Jan 1982 Jahr
2.094 Mlrd.
+389.41 Mln.
22.85%
1 Jan 1983 Jahr
2.068 Mlrd.
-25.269 Mln.
-1.21%
1 Jan 1984 Jahr
1.878 Mlrd.
-190.821 Mln.
-9.23%
1 Jan 1985 Jahr
1.984 Mlrd.
+106.127 Mln.
5.65%
1 Jan 1986 Jahr
2.057 Mlrd.
+73.404 Mln.
3.7%
1 Jan 1987 Jahr
1.891 Mlrd.
-166.122 Mln.
-8.08%
1 Jan 1988 Jahr
2.283 Mlrd.
+392.19 Mln.
20.74%
1 Jan 1989 Jahr
2.469 Mlrd.
+185.615 Mln.
8.13%
1 Jan 1990 Jahr
2.388 Mlrd.
-81.08 Mln.
-3.28%
1 Jan 1991 Jahr
2.578 Mlrd.
+190.633 Mln.
7.98%
1 Jan 1992 Jahr
2.595 Mlrd.
+16.699 Mln.
0.65%
1 Jan 1993 Jahr
2.781 Mlrd.
+185.608 Mln.
7.15%
1 Jan 1994 Jahr
2.919 Mlrd.
+138.358 Mln.
4.98%
1 Jan 1995 Jahr
3.059 Mlrd.
+140.209 Mln.
4.8%
1 Jan 1996 Jahr
3.594 Mlrd.
+535.35 Mln.
17.5%
1 Jan 1997 Jahr
3.775 Mlrd.
+180.4 Mln.
5.02%
1 Jan 1998 Jahr
3.821 Mlrd.
+45.698 Mln.
1.21%
1 Jan 1999 Jahr
3.934 Mlrd.
+113.822 Mln.
2.98%
1 Jan 2000 Jahr
4.001 Mlrd.
+66.714 Mln.
1.7%
1 Jan 2001 Jahr
4.207 Mlrd.
+205.811 Mln.
5.14%
1 Jan 2002 Jahr
4.434 Mlrd.
+227.452 Mln.
5.41%
1 Jan 2003 Jahr
5.036 Mlrd.
+601.293 Mln.
13.56%
1 Jan 2004 Jahr
5.38 Mlrd.
+344.704 Mln.
6.85%
1 Jan 2005 Jahr
6.605 Mlrd.
+1.225 Mlrd.
22.76%
1 Jan 2006 Jahr
7.426 Mlrd.
+821.324 Mln.
12.43%
1 Jan 2007 Jahr
9.144 Mlrd.
+1.718 Mlrd.
23.13%
1 Jan 2008 Jahr
10.684 Mlrd.
+1.54 Mlrd.
16.84%
1 Jan 2009 Jahr
13.751 Mlrd.
+3.067 Mlrd.
28.71%
1 Jan 2010 Jahr
12.022 Mlrd.
-1.728 Mlrd.
-12.57%
1 Jan 2011 Jahr
13.639 Mlrd.
+1.617 Mlrd.
13.45%
1 Jan 2012 Jahr
14.454 Mlrd.
+815.141 Mln.
5.98%
1 Jan 2013 Jahr
14.998 Mlrd.
+543.408 Mln.
3.76%
1 Jan 2014 Jahr
15.021 Mlrd.
+23.507 Mln.
0.16%
1 Jan 2015 Jahr
16.405 Mlrd.
+1.384 Mlrd.
9.21%
1 Jan 2016 Jahr
14.872 Mlrd.
-1.533 Mlrd.
-9.34%
Bewertung der Länder gemäß mit laufender Statistik nach Jahren


Kommentare: