29
/de/
de
AIzaSyAYiBZKx7MnpbEhh9jyipgxe19OcubqV5w
April 1, 2024
161652
Italy
ITA
true
2
1
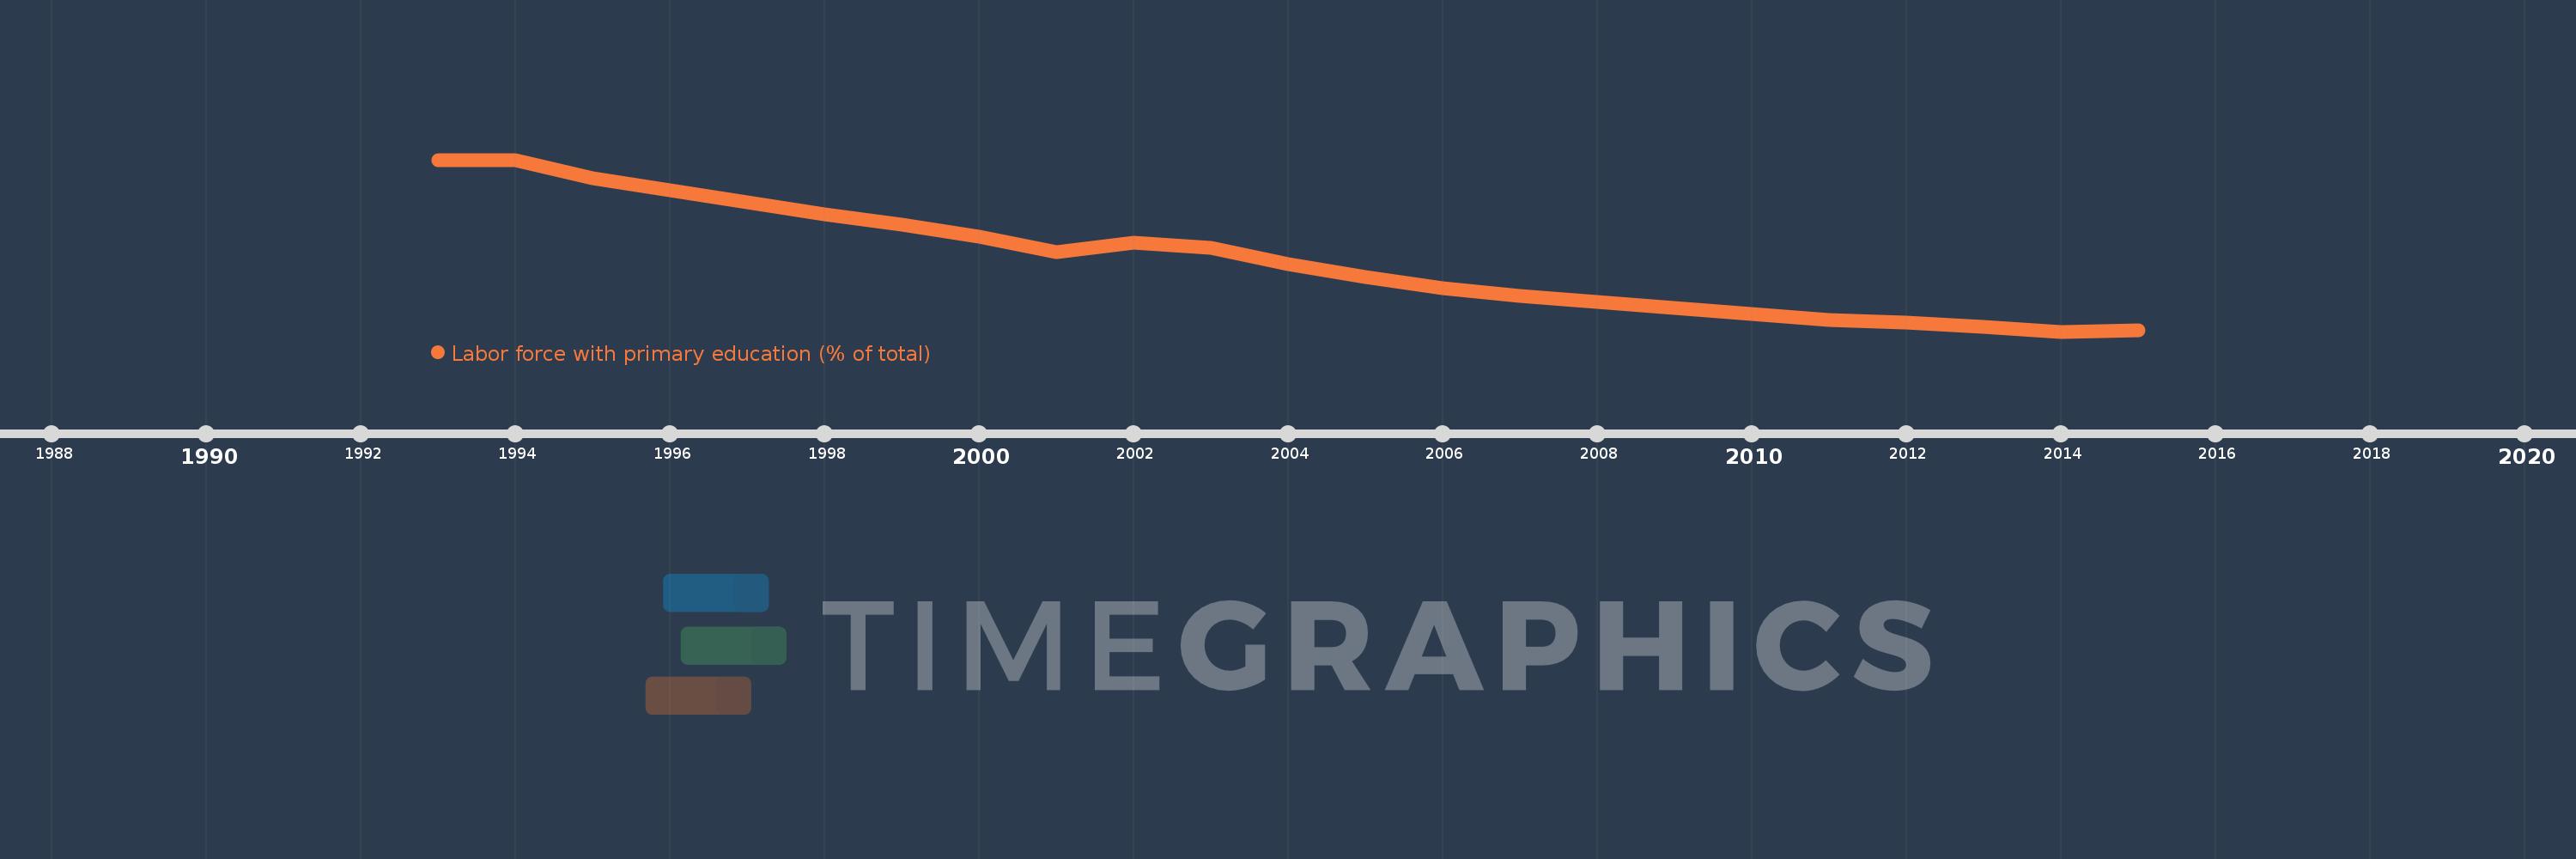
Labor force with primary education (% of total)
2015,2014,2013,2012,2011,2010,2009,2008,2007,2006,2005,2004,2003,2002,2001,2000,1999,1998,1997,1996,1995,1994,1993
Diese Statistik in anderen Ländern:
Zeitlinie:
Diese Zeitleiste vorliegt die Graphik ab 1993 J. bis 2015 J. Italy. Die Angaben bis 1992 J. sind nicht vorhanden. Die Zahl aktueller Beobachtungen nach Daten: 23.
Die Quelle (Bezeichnung):
Kennzahlen der Weltentwicklung
Die Quelle (Einrichtung):
International Labour Organization, Key Indicators of the Labour Market database.
Kategorien:
Education, Social Protection & Labor
Es wurde aktualisiert:
23 Apr 2017 Jahr
Kennzahlen der Wertänderungen vom Jahr zum Jahr
Minimum:
33.3
1 Jan 2014 Jahr
Maximum:
59.0
1 Jan 1993 Jahr
Zum Datum der Beobachtung
Wert
Absolute Veränderung
Die Veränderung bezüglich dem vorherigen Wert
1 Jan 1993 Jahr
59.0
+59.0
0.0%
1 Jan 1994 Jahr
58.9
-0.1
-0.17%
1 Jan 1995 Jahr
56.2
-2.7
-4.58%
1 Jan 1996 Jahr
54.5
-1.7
-3.02%
1 Jan 1997 Jahr
52.6
-1.9
-3.49%
1 Jan 1998 Jahr
50.8
-1.8
-3.42%
1 Jan 1999 Jahr
49.3
-1.5
-2.95%
1 Jan 2000 Jahr
47.5
-1.8
-3.65%
1 Jan 2001 Jahr
45.2
-2.3
-4.84%
1 Jan 2002 Jahr
46.6
+1.4
3.1%
1 Jan 2003 Jahr
45.8
-0.8
-1.72%
1 Jan 2004 Jahr
43.4
-2.4
-5.24%
1 Jan 2005 Jahr
41.4
-2.0
-4.61%
1 Jan 2006 Jahr
39.8
-1.6
-3.86%
1 Jan 2007 Jahr
38.6
-1.2
-3.02%
1 Jan 2008 Jahr
37.7
-0.9
-2.33%
1 Jan 2009 Jahr
36.8
-0.9
-2.39%
1 Jan 2010 Jahr
35.9
-0.9
-2.45%
1 Jan 2011 Jahr
35.0
-0.9
-2.51%
1 Jan 2012 Jahr
34.6
-0.4
-1.14%
1 Jan 2013 Jahr
34.0
-0.6
-1.73%
1 Jan 2014 Jahr
33.3
-0.7
-2.06%
1 Jan 2015 Jahr
33.5
+0.2
0.6%
Bewertung der Länder gemäß mit laufender Statistik nach Jahren


Kommentare: