29
/de/
de
AIzaSyAYiBZKx7MnpbEhh9jyipgxe19OcubqV5w
April 1, 2024
158393
Iraq
IRQ
true
2
1
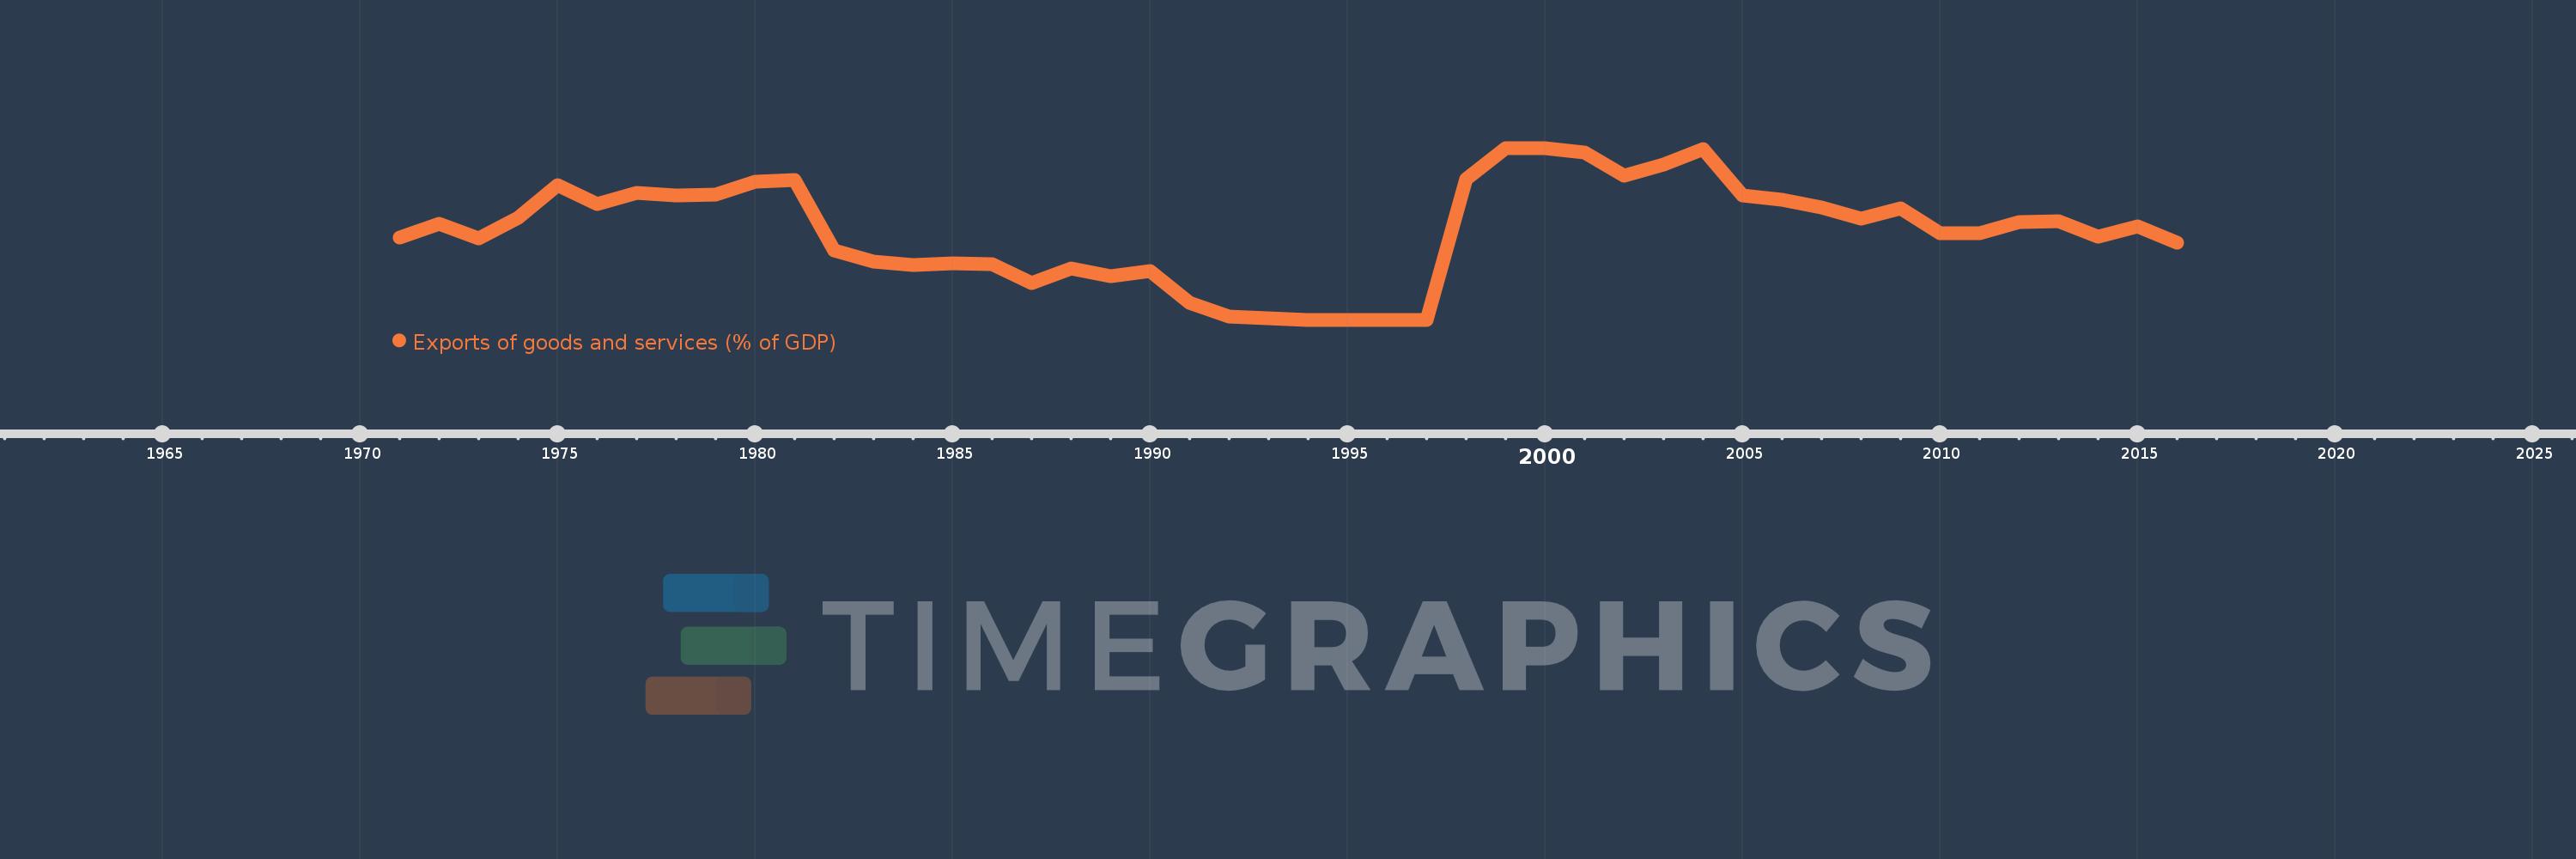
Exports of goods and services (% of GDP)
2016,2015,2014,2013,2012,2011,2010,2009,2008,2007,2006,2005,2004,2003,2002,2001,2000,1999,1998,1997,1996,1995,1994,1993,1992,1991,1990,1989,1988,1987,1986,1985,1984,1983,1982,1981,1980,1979,1978,1977,1976,1975,1974,1973,1972,1971
Diese Statistik in anderen Ländern:
AfghanistanAlbaniaAlgeriaAngolaAntigua and BarbudaArab WorldArgentinaArmeniaArubaAustraliaAustriaAzerbaijanBahamas, TheBahrainBangladeshBarbadosBelarusBelgiumBelizeBeninBermudaBhutanBoliviaBosnia and HerzegovinaBotswanaBrazilBrunei DarussalamBulgariaBurkina FasoBurundiCabo VerdeCambodiaCameroonCanadaCaribbean small statesCentral African RepublicCentral Europe and the BalticsChadChileChinaColombiaComorosCongo, Dem. Rep.Congo, Rep.Costa RicaCote d'IvoireCroatiaCubaCyprusCzech RepublicDenmarkDjiboutiDominicaDominican RepublicEarly-demographic dividendEast Asia & PacificEast Asia & Pacific (excluding high income)East Asia & Pacific (IDA & IBRD countries)EcuadorEgypt, Arab Rep.El SalvadorEquatorial GuineaEritreaEstoniaEthiopiaEuro areaEurope & Central AsiaEurope & Central Asia (excluding high income)Europe & Central Asia (IDA & IBRD countries)European UnionFaroe IslandsFijiFinlandFragile and conflict affected situationsFranceFrench PolynesiaGabonGambia, TheGeorgiaGermanyGhanaGreeceGrenadaGuatemalaGuineaGuinea-BissauGuyanaHaitiHeavily indebted poor countries (HIPC)High incomeHondurasHong Kong SAR, ChinaHungaryIBRD onlyIcelandIDA & IBRD totalIDA blendIDA onlyIDA totalIndiaIndonesiaIran, Islamic Rep.IraqIrelandIsraelItalyJamaicaJapanJordanKazakhstanKenyaKiribatiKorea, Rep.KosovoKuwaitKyrgyz RepublicLao PDRLate-demographic dividendLatin America & Caribbean Latin America & Caribbean (excluding high income)Latin America & the Caribbean (IDA & IBRD countries)LatviaLeast developed countries: UN classificationLebanonLesothoLiberiaLibyaLithuaniaLow & middle incomeLow incomeLower middle incomeLuxembourgMacao SAR, ChinaMacedonia, FYRMadagascarMalawiMalaysiaMaldivesMaliMaltaMauritaniaMauritiusMexicoMicronesia, Fed. Sts.Middle East & North AfricaMiddle East & North Africa (excluding high income)Middle East & North Africa (IDA & IBRD countries)Middle incomeMoldovaMongoliaMontenegroMoroccoMozambiqueMyanmarNamibiaNepalNetherlandsNew CaledoniaNew ZealandNicaraguaNigerNigeriaNorth AmericaNorwayOECD membersOmanOther small statesPacific island small statesPakistanPalauPanamaPapua New GuineaParaguayPeruPhilippinesPolandPortugalPost-demographic dividendPre-demographic dividendPuerto RicoQatarRomaniaRussian FederationRwandaSamoaSaudi ArabiaSenegalSerbiaSeychellesSierra LeoneSingaporeSlovak RepublicSloveniaSmall statesSolomon IslandsSomaliaSouth AfricaSouth AsiaSouth Asia (IDA & IBRD)South SudanSpainSri LankaSt. Kitts and NevisSt. LuciaSt. Vincent and the GrenadinesSub-Saharan Africa Sub-Saharan Africa (excluding high income)Sub-Saharan Africa (IDA & IBRD countries)SudanSurinameSwazilandSwedenSwitzerlandSyrian Arab RepublicTajikistanTanzaniaThailandTimor-LesteTogoTongaTrinidad and TobagoTunisiaTurkeyTurkmenistanUgandaUkraineUnited Arab EmiratesUnited KingdomUnited StatesUpper middle incomeUruguayUzbekistanVanuatuVenezuela, RBVietnamWest Bank and GazaWorldYemen, Rep.ZambiaZimbabwe Zeitlinie:
Diese Zeitleiste vorliegt die Graphik ab 1971 J. bis 2016 J. Iraq. Die Angaben bis 1970 J. sind nicht vorhanden. Die Zahl aktueller Beobachtungen nach Daten: 46.
Die Quelle (Bezeichnung):
Kennzahlen der Weltentwicklung
Die Quelle (Einrichtung):
World Bank national accounts data, and OECD National Accounts data files.
Kategorien:
Economy & Growth, Trade
Es wurde aktualisiert:
23 Apr 2017 Jahr
Kennzahlen der Wertänderungen vom Jahr zum Jahr
Minimum:
0.005
1 Jan 1996 Jahr
Maximum:
77.899
1 Jan 1999 Jahr
Zum Datum der Beobachtung
Wert
Absolute Veränderung
Die Veränderung bezüglich dem vorherigen Wert
1 Jan 1971 Jahr
37.333
+37.333
0.0%
1 Jan 1972 Jahr
43.655
+6.322
16.94%
1 Jan 1973 Jahr
36.926
-6.729
-15.41%
1 Jan 1974 Jahr
46.328
+9.403
25.46%
1 Jan 1975 Jahr
61.04
+14.711
31.75%
1 Jan 1976 Jahr
52.329
-8.711
-14.27%
1 Jan 1977 Jahr
57.37
+5.041
9.63%
1 Jan 1978 Jahr
56.198
-1.172
-2.04%
1 Jan 1979 Jahr
56.678
+0.48
0.85%
1 Jan 1980 Jahr
62.453
+5.775
10.19%
1 Jan 1981 Jahr
63.487
+1.034
1.66%
1 Jan 1982 Jahr
31.619
-31.868
-50.2%
1 Jan 1983 Jahr
26.351
-5.268
-16.66%
1 Jan 1984 Jahr
24.621
-1.731
-6.57%
1 Jan 1985 Jahr
25.664
+1.043
4.24%
1 Jan 1986 Jahr
25.145
-0.519
-2.02%
1 Jan 1987 Jahr
16.502
-8.643
-34.37%
1 Jan 1988 Jahr
23.222
+6.721
40.73%
1 Jan 1989 Jahr
19.687
-3.535
-15.22%
1 Jan 1990 Jahr
21.965
+2.278
11.57%
1 Jan 1991 Jahr
7.698
-14.267
-64.95%
1 Jan 1992 Jahr
1.29
-6.408
-83.24%
1 Jan 1993 Jahr
0.582
-0.708
-54.87%
1 Jan 1994 Jahr
0.076
-0.507
-87.03%
1 Jan 1995 Jahr
0.036
-0.04
-52.92%
1 Jan 1996 Jahr
0.005
-0.03
-84.88%
1 Jan 1997 Jahr
0.009
+0.004
70.4%
1 Jan 1998 Jahr
63.847
+63.838
696.78 Tsnd.%
1 Jan 1999 Jahr
77.899
+14.052
22.01%
1 Jan 2000 Jahr
77.635
-0.264
-0.34%
1 Jan 2001 Jahr
75.704
-1.931
-2.49%
1 Jan 2002 Jahr
65.273
-10.43
-13.78%
1 Jan 2003 Jahr
70.57
+5.297
8.11%
1 Jan 2004 Jahr
77.393
+6.823
9.67%
1 Jan 2005 Jahr
56.271
-21.122
-27.29%
1 Jan 2006 Jahr
54.348
-1.923
-3.42%
1 Jan 2007 Jahr
51.032
-3.316
-6.1%
1 Jan 2008 Jahr
45.9
-5.132
-10.06%
1 Jan 2009 Jahr
50.328
+4.428
9.65%
1 Jan 2010 Jahr
39.4
-10.928
-21.71%
1 Jan 2011 Jahr
39.417
+0.017
0.04%
1 Jan 2012 Jahr
44.418
+5.001
12.69%
1 Jan 2013 Jahr
44.508
+0.091
0.2%
1 Jan 2014 Jahr
37.706
-6.802
-15.28%
1 Jan 2015 Jahr
42.393
+4.686
12.43%
1 Jan 2016 Jahr
34.795
-7.598
-17.92%
Bewertung der Länder gemäß mit laufender Statistik nach Jahren


Kommentare: