29
/de/
de
AIzaSyAYiBZKx7MnpbEhh9jyipgxe19OcubqV5w
April 1, 2024
156761
Indonesia
IDN
true
2
1
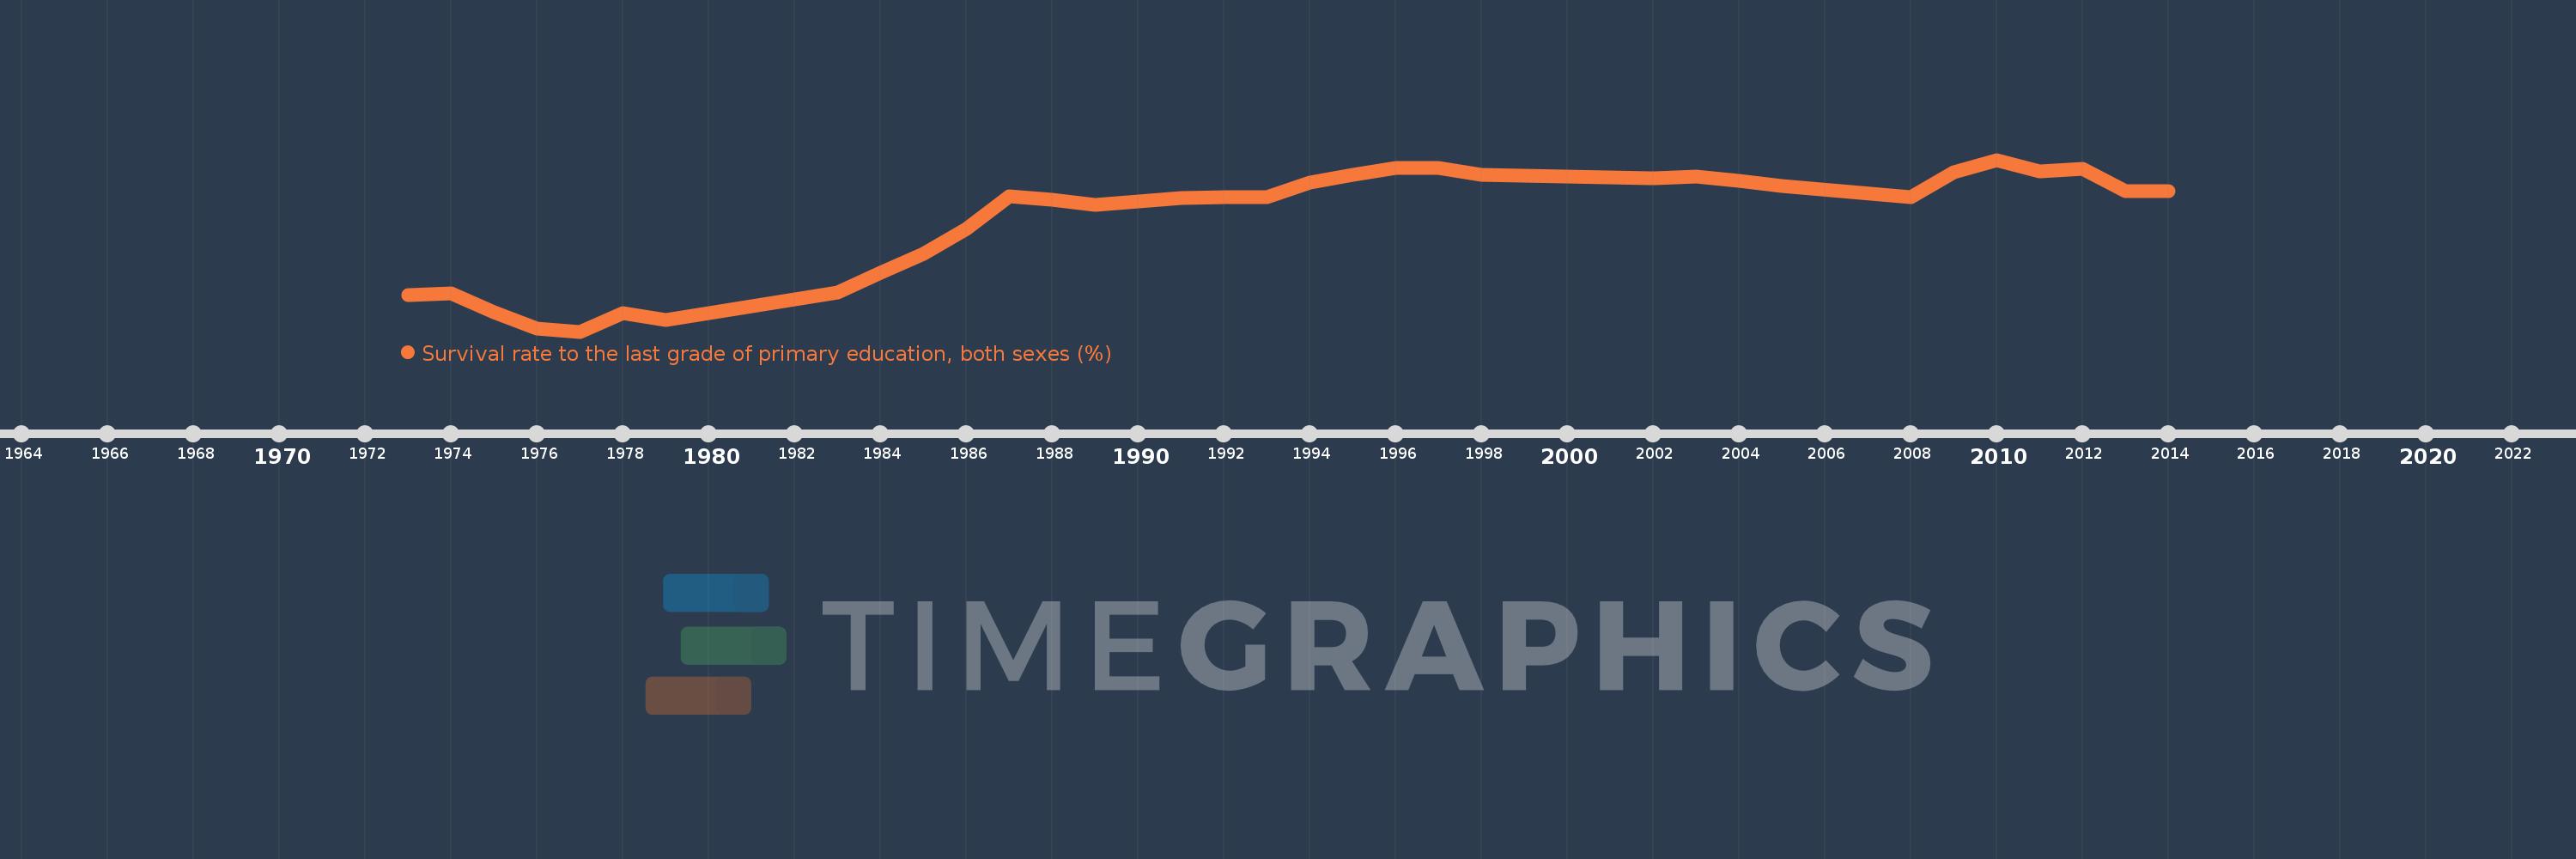
Survival rate to the last grade of primary education, both sexes (%)
2014,2013,2012,2011,2010,2009,2008,2005,2004,2003,2002,1998,1997,1996,1995,1994,1993,1992,1991,1990,1989,1988,1987,1986,1985,1984,1983,1979,1978,1977,1976,1975,1974,1973
Diese Statistik in anderen Ländern:
AfghanistanAlbaniaAlgeriaAndorraAngolaAntigua and BarbudaArab WorldArgentinaArmeniaArubaAustriaAzerbaijanBahamas, TheBahrainBangladeshBarbadosBelarusBelgiumBelizeBeninBermudaBhutanBoliviaBosnia and HerzegovinaBotswanaBrazilBrunei DarussalamBulgariaBurkina FasoBurundiCabo VerdeCambodiaCameroonCanadaCaribbean small statesCayman IslandsCentral African RepublicCentral Europe and the BalticsChadChileChinaColombiaComorosCongo, Dem. Rep.Congo, Rep.Costa RicaCote d'IvoireCroatiaCubaCyprusCzech RepublicDenmarkDjiboutiDominicaDominican RepublicEarly-demographic dividendEast Asia & PacificEast Asia & Pacific (excluding high income)East Asia & Pacific (IDA & IBRD countries)EcuadorEgypt, Arab Rep.El SalvadorEquatorial GuineaEritreaEstoniaEthiopiaEuro areaEurope & Central AsiaEurope & Central Asia (excluding high income)Europe & Central Asia (IDA & IBRD countries)European UnionFijiFinlandFragile and conflict affected situationsFranceGabonGambia, TheGeorgiaGermanyGhanaGreeceGuatemalaGuineaGuinea-BissauGuyanaHaitiHeavily indebted poor countries (HIPC)High incomeHondurasHong Kong SAR, ChinaHungaryIBRD onlyIcelandIDA & IBRD totalIDA blendIDA onlyIDA totalIndiaIndonesiaIran, Islamic Rep.IraqIsraelItalyJamaicaJapanJordanKazakhstanKenyaKiribatiKorea, Rep.KuwaitKyrgyz RepublicLao PDRLate-demographic dividendLatin America & Caribbean Latin America & Caribbean (excluding high income)Latin America & the Caribbean (IDA & IBRD countries)LatviaLeast developed countries: UN classificationLebanonLesothoLiberiaLibyaLiechtensteinLithuaniaLow & middle incomeLow incomeLower middle incomeLuxembourgMacao SAR, ChinaMacedonia, FYRMadagascarMalawiMalaysiaMaldivesMaliMaltaMarshall IslandsMauritaniaMauritiusMexicoMiddle East & North AfricaMiddle East & North Africa (excluding high income)Middle East & North Africa (IDA & IBRD countries)Middle incomeMoldovaMonacoMongoliaMontenegroMoroccoMozambiqueMyanmarNamibiaNepalNetherlandsNicaraguaNigerNigeriaNorth AmericaNorwayOECD membersOmanOther small statesPacific island small statesPakistanPanamaPapua New GuineaParaguayPeruPhilippinesPolandPortugalPost-demographic dividendPre-demographic dividendQatarRomaniaRussian FederationRwandaSamoaSan MarinoSao Tome and PrincipeSaudi ArabiaSenegalSerbiaSeychellesSierra LeoneSingaporeSlovak RepublicSloveniaSmall statesSolomon IslandsSouth AfricaSouth AsiaSouth Asia (IDA & IBRD)SpainSri LankaSt. Kitts and NevisSt. LuciaSt. Vincent and the GrenadinesSub-Saharan Africa Sub-Saharan Africa (excluding high income)Sub-Saharan Africa (IDA & IBRD countries)SudanSurinameSwazilandSwedenSwitzerlandSyrian Arab RepublicTajikistanTanzaniaThailandTimor-LesteTogoTongaTrinidad and TobagoTunisiaTurkeyUgandaUkraineUnited Arab EmiratesUpper middle incomeUruguayUzbekistanVanuatuVenezuela, RBVietnamWest Bank and GazaWorldYemen, Rep.ZambiaZimbabwe Zeitlinie:
Diese Zeitleiste vorliegt die Graphik ab 1973 J. bis 2014 J. Indonesia. Die Angaben bis 1972 J. sind nicht vorhanden. Die Zahl aktueller Beobachtungen nach Daten: 34.
Die Quelle (Bezeichnung):
Kennzahlen der Weltentwicklung
Die Quelle (Einrichtung):
UNESCO Institute for Statistics
Kategorien:
Education
Es wurde aktualisiert:
23 Apr 2017 Jahr
Kennzahlen der Wertänderungen vom Jahr zum Jahr
Minimum:
37.046
1 Jan 1977 Jahr
Maximum:
91.8
1 Jan 2010 Jahr
Zum Datum der Beobachtung
Wert
Absolute Veränderung
Die Veränderung bezüglich dem vorherigen Wert
1 Jan 1973 Jahr
48.81
+48.81
0.0%
1 Jan 1974 Jahr
49.29
+0.48
0.98%
1 Jan 1975 Jahr
43.276
-6.014
-12.2%
1 Jan 1976 Jahr
37.986
-5.29
-12.22%
1 Jan 1977 Jahr
37.046
-0.939
-2.47%
1 Jan 1978 Jahr
42.949
+5.903
15.93%
1 Jan 1979 Jahr
40.821
-2.129
-4.96%
1 Jan 1983 Jahr
49.553
+8.732
21.39%
1 Jan 1984 Jahr
55.803
+6.251
12.61%
1 Jan 1985 Jahr
61.726
+5.922
10.61%
1 Jan 1986 Jahr
69.8
+8.074
13.08%
1 Jan 1987 Jahr
80.296
+10.496
15.04%
1 Jan 1988 Jahr
79.03
-1.266
-1.58%
1 Jan 1989 Jahr
77.547
-1.483
-1.88%
1 Jan 1990 Jahr
78.619
+1.072
1.38%
1 Jan 1991 Jahr
79.709
+1.09
1.39%
1 Jan 1992 Jahr
79.798
+0.088
0.11%
1 Jan 1993 Jahr
79.907
+0.11
0.14%
1 Jan 1994 Jahr
84.553
+4.646
5.81%
1 Jan 1995 Jahr
87.003
+2.45
2.9%
1 Jan 1996 Jahr
89.227
+2.224
2.56%
1 Jan 1997 Jahr
89.319
+0.092
0.1%
1 Jan 1998 Jahr
87.051
-2.268
-2.54%
1 Jan 2002 Jahr
85.89
-1.161
-1.33%
1 Jan 2003 Jahr
86.369
+0.479
0.56%
1 Jan 2004 Jahr
85.101
-1.268
-1.47%
1 Jan 2005 Jahr
83.447
-1.655
-1.94%
1 Jan 2008 Jahr
79.977
-3.47
-4.16%
1 Jan 2009 Jahr
87.87
+7.893
9.87%
1 Jan 2010 Jahr
91.8
+3.93
4.47%
1 Jan 2011 Jahr
87.999
-3.8
-4.14%
1 Jan 2012 Jahr
88.975
+0.976
1.11%
1 Jan 2013 Jahr
81.802
-7.173
-8.06%
1 Jan 2014 Jahr
81.941
+0.139
0.17%
Bewertung der Länder gemäß mit laufender Statistik nach Jahren


Kommentare: