29
/de/
de
AIzaSyAYiBZKx7MnpbEhh9jyipgxe19OcubqV5w
April 1, 2024
155894
Indonesia
IDN
true
2
1
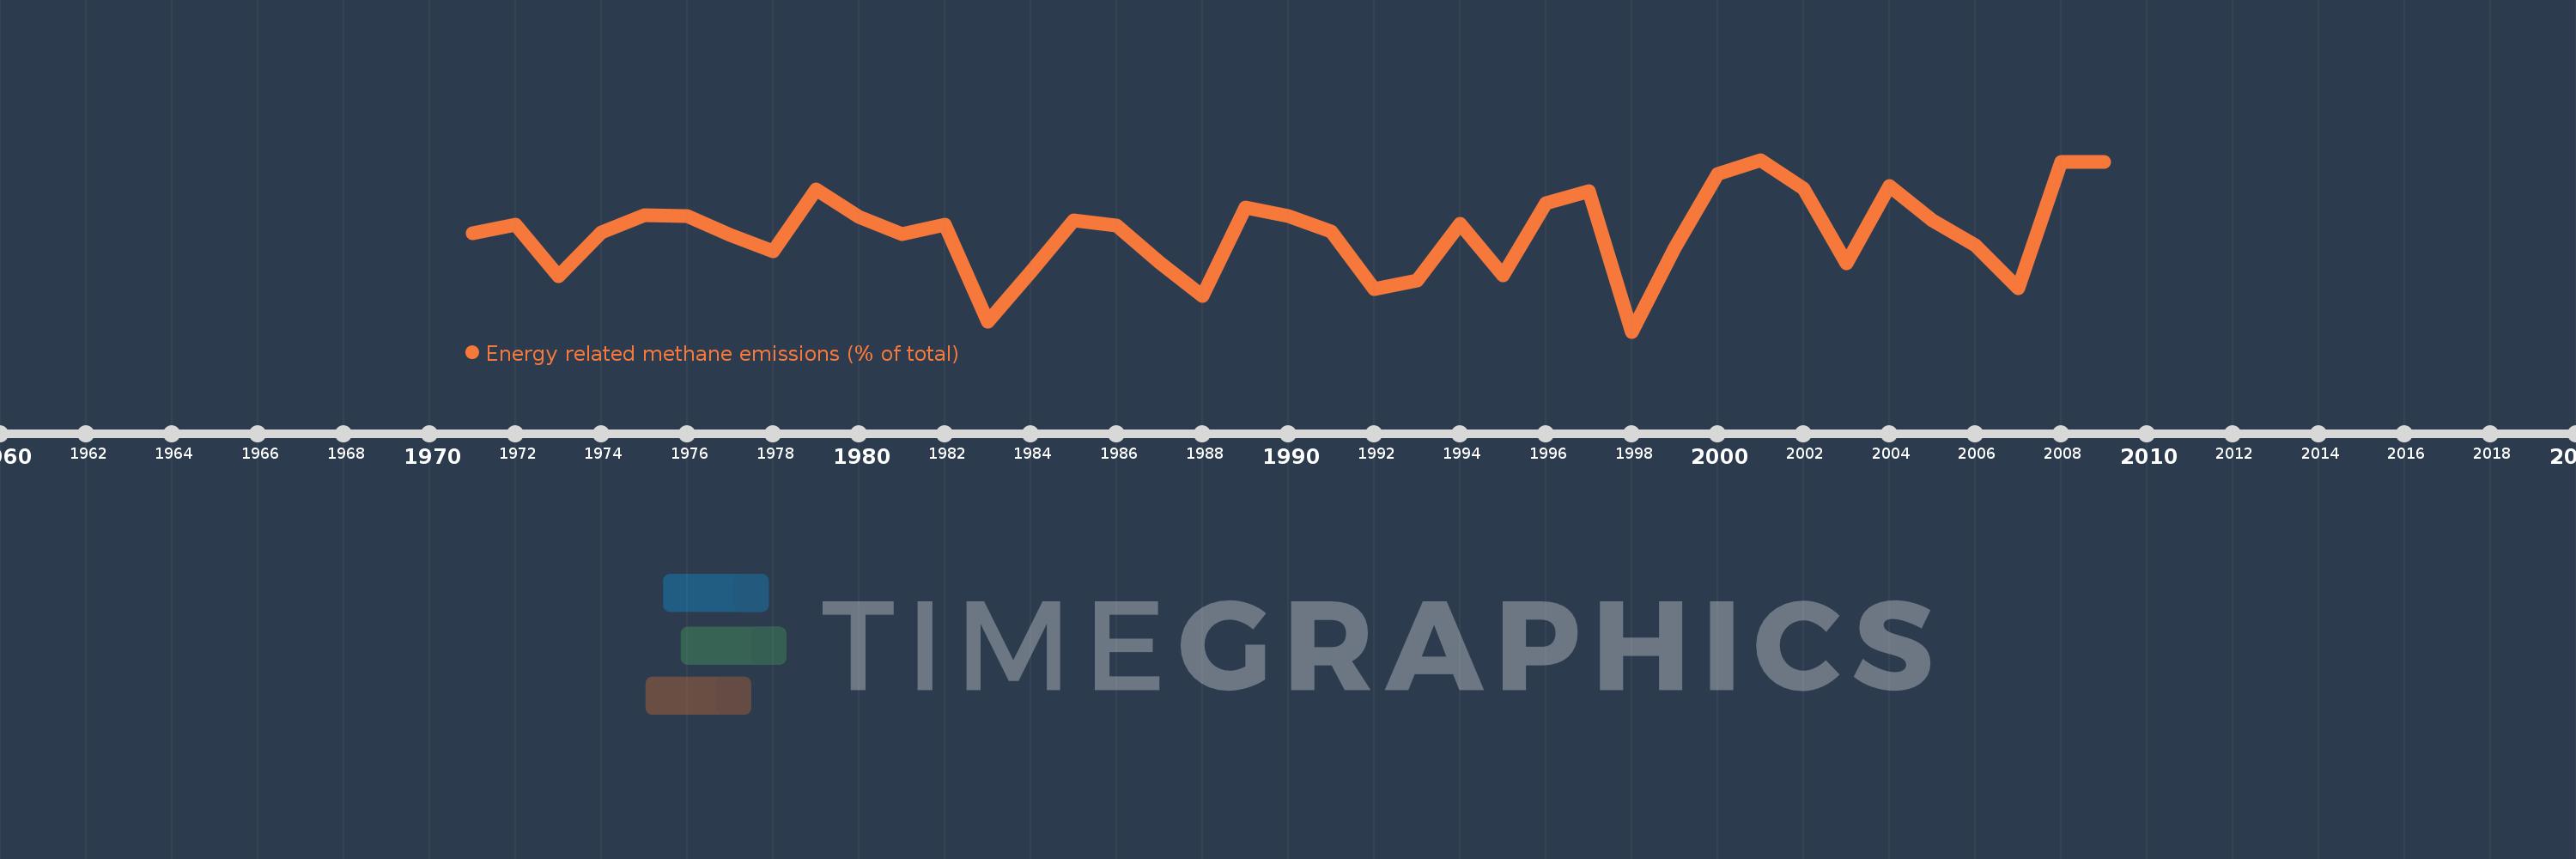
Energy related methane emissions (% of total)
2009,2008,2007,2006,2005,2004,2003,2002,2001,2000,1999,1998,1997,1996,1995,1994,1993,1992,1991,1990,1989,1988,1987,1986,1985,1984,1983,1982,1981,1980,1979,1978,1977,1976,1975,1974,1973,1972,1971
Diese Statistik in anderen Ländern:
AfghanistanAlbaniaAlgeriaAmerican SamoaAngolaAntigua and BarbudaArab WorldArgentinaArmeniaArubaAustraliaAustriaAzerbaijanBahamas, TheBahrainBangladeshBarbadosBelarusBelgiumBelizeBeninBermudaBhutanBoliviaBosnia and HerzegovinaBotswanaBrazilBritish Virgin IslandsBrunei DarussalamBulgariaBurkina FasoBurundiCabo VerdeCambodiaCameroonCanadaCaribbean small statesCayman IslandsCentral African RepublicCentral Europe and the BalticsChadChileChinaColombiaComorosCongo, Dem. Rep.Congo, Rep.Costa RicaCote d'IvoireCroatiaCubaCyprusCzech RepublicDenmarkDjiboutiDominicaDominican RepublicEarly-demographic dividendEast Asia & PacificEast Asia & Pacific (excluding high income)East Asia & Pacific (IDA & IBRD countries)EcuadorEgypt, Arab Rep.El SalvadorEquatorial GuineaEritreaEstoniaEthiopiaEuro areaEurope & Central AsiaEurope & Central Asia (excluding high income)Europe & Central Asia (IDA & IBRD countries)European UnionFaroe IslandsFijiFinlandFragile and conflict affected situationsFranceFrench PolynesiaGabonGambia, TheGeorgiaGermanyGhanaGibraltarGreeceGreenlandGrenadaGuamGuatemalaGuineaGuinea-BissauGuyanaHaitiHeavily indebted poor countries (HIPC)High incomeHondurasHong Kong SAR, ChinaHungaryIBRD onlyIcelandIDA & IBRD totalIDA blendIDA onlyIDA totalIndiaIndonesiaIran, Islamic Rep.IraqIrelandIsraelItalyJamaicaJapanJordanKazakhstanKenyaKiribatiKorea, Dem. People’s Rep.Korea, Rep.KuwaitKyrgyz RepublicLao PDRLate-demographic dividendLatin America & Caribbean Latin America & Caribbean (excluding high income)Latin America & the Caribbean (IDA & IBRD countries)LatviaLeast developed countries: UN classificationLebanonLesothoLiberiaLibyaLithuaniaLow & middle incomeLow incomeLower middle incomeLuxembourgMacao SAR, ChinaMacedonia, FYRMadagascarMalawiMalaysiaMaldivesMaliMaltaMarshall IslandsMauritaniaMauritiusMexicoMicronesia, Fed. Sts.Middle East & North AfricaMiddle East & North Africa (excluding high income)Middle East & North Africa (IDA & IBRD countries)Middle incomeMoldovaMongoliaMoroccoMozambiqueMyanmarNamibiaNauruNepalNetherlandsNew CaledoniaNew ZealandNicaraguaNigerNigeriaNorth AmericaNorthern Mariana IslandsNorwayOECD membersOmanOther small statesPacific island small statesPakistanPalauPanamaPapua New GuineaParaguayPeruPhilippinesPolandPortugalPost-demographic dividendPre-demographic dividendPuerto RicoQatarRomaniaRussian FederationRwandaSamoaSao Tome and PrincipeSaudi ArabiaSenegalSerbiaSeychellesSierra LeoneSingaporeSlovak RepublicSloveniaSmall statesSolomon IslandsSomaliaSouth AfricaSouth AsiaSouth Asia (IDA & IBRD)SpainSri LankaSt. Kitts and NevisSt. LuciaSt. Vincent and the GrenadinesSub-Saharan Africa Sub-Saharan Africa (excluding high income)Sub-Saharan Africa (IDA & IBRD countries)SudanSurinameSwazilandSwedenSwitzerlandSyrian Arab RepublicTajikistanTanzaniaThailandTimor-LesteTogoTongaTrinidad and TobagoTunisiaTurkeyTurkmenistanTurks and Caicos IslandsTuvaluUgandaUkraineUnited Arab EmiratesUnited KingdomUnited StatesUpper middle incomeUruguayUzbekistanVanuatuVenezuela, RBVietnamVirgin Islands (U.S.)WorldYemen, Rep.ZambiaZimbabwe Zeitlinie:
Diese Zeitleiste vorliegt die Graphik ab 1971 J. bis 2009 J. Indonesia. Die Angaben bis 1970 J. sind nicht vorhanden. Die Zahl aktueller Beobachtungen nach Daten: 39.
Die Quelle (Bezeichnung):
Kennzahlen der Weltentwicklung
Die Quelle (Einrichtung):
World Bank staff estimates from original source: European Commission, Joint Research Centre (JRC)/Netherlands Environmental Assessment Agency (PBL). Emission Database for Global Atmospheric Research (EDGAR): http://edgar.jrc.ec.europa.eu/.
Kategorien:
Energy & Mining, Environment
Es wurde aktualisiert:
23 Apr 2017 Jahr
Kennzahlen der Wertänderungen vom Jahr zum Jahr
Minimum:
5.031
1 Jan 1998 Jahr
Maximum:
26.988
1 Jan 2001 Jahr
Zum Datum der Beobachtung
Wert
Absolute Veränderung
Die Veränderung bezüglich dem vorherigen Wert
1 Jan 1971 Jahr
17.623
+17.623
0.0%
1 Jan 1972 Jahr
18.708
+1.085
6.16%
1 Jan 1973 Jahr
12.098
-6.61
-35.33%
1 Jan 1974 Jahr
17.675
+5.577
46.09%
1 Jan 1975 Jahr
19.923
+2.248
12.72%
1 Jan 1976 Jahr
19.755
-0.168
-0.84%
1 Jan 1977 Jahr
17.344
-2.411
-12.2%
1 Jan 1978 Jahr
15.299
-2.045
-11.79%
1 Jan 1979 Jahr
23.163
+7.864
51.41%
1 Jan 1980 Jahr
19.737
-3.426
-14.79%
1 Jan 1981 Jahr
17.467
-2.27
-11.5%
1 Jan 1982 Jahr
18.72
+1.254
7.18%
1 Jan 1983 Jahr
6.31
-12.41
-66.29%
1 Jan 1984 Jahr
12.659
+6.349
100.61%
1 Jan 1985 Jahr
19.246
+6.587
52.04%
1 Jan 1986 Jahr
18.638
-0.609
-3.16%
1 Jan 1987 Jahr
13.92
-4.718
-25.32%
1 Jan 1988 Jahr
9.626
-4.294
-30.85%
1 Jan 1989 Jahr
20.899
+11.273
117.11%
1 Jan 1990 Jahr
19.846
-1.053
-5.04%
1 Jan 1991 Jahr
17.854
-1.992
-10.04%
1 Jan 1992 Jahr
10.456
-7.398
-41.43%
1 Jan 1993 Jahr
11.534
+1.078
10.31%
1 Jan 1994 Jahr
18.759
+7.224
62.63%
1 Jan 1995 Jahr
12.189
-6.569
-35.02%
1 Jan 1996 Jahr
21.468
+9.278
76.12%
1 Jan 1997 Jahr
22.967
+1.499
6.98%
1 Jan 1998 Jahr
5.031
-17.936
-78.1%
1 Jan 1999 Jahr
15.788
+10.757
213.83%
1 Jan 2000 Jahr
25.216
+9.428
59.72%
1 Jan 2001 Jahr
26.988
+1.773
7.03%
1 Jan 2002 Jahr
23.304
-3.684
-13.65%
1 Jan 2003 Jahr
13.794
-9.51
-40.81%
1 Jan 2004 Jahr
23.586
+9.792
70.99%
1 Jan 2005 Jahr
19.278
-4.308
-18.26%
1 Jan 2006 Jahr
16.016
-3.262
-16.92%
1 Jan 2007 Jahr
10.592
-5.424
-33.87%
1 Jan 2008 Jahr
26.76
+16.168
152.64%
1 Jan 2009 Jahr
26.737
-0.023
-0.09%
Bewertung der Länder gemäß mit laufender Statistik nach Jahren


Kommentare: