29
/de/
de
AIzaSyAYiBZKx7MnpbEhh9jyipgxe19OcubqV5w
April 1, 2024
154188
India
IND
true
2
1
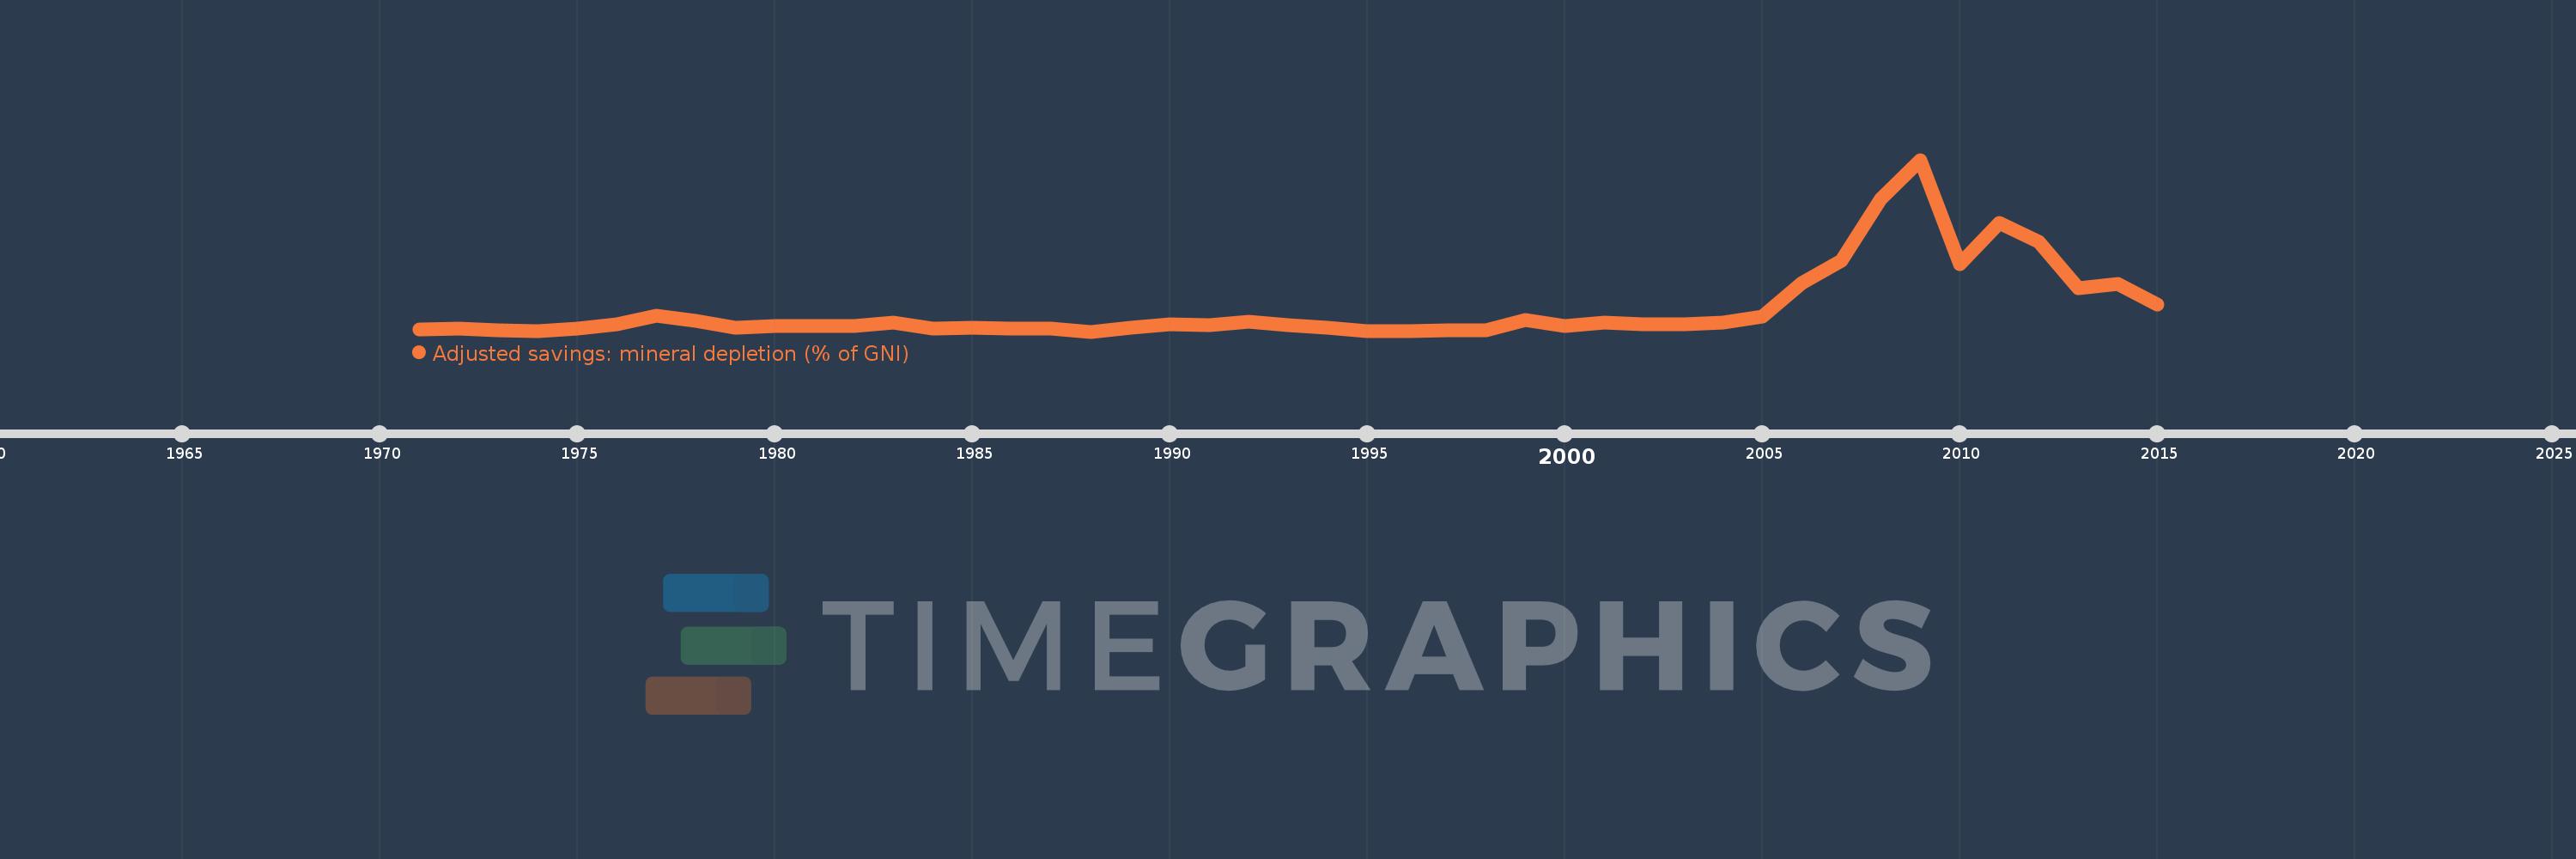
Adjusted savings: mineral depletion (% of GNI)
2015,2014,2013,2012,2011,2010,2009,2008,2007,2006,2005,2004,2003,2002,2001,2000,1999,1998,1997,1996,1995,1994,1993,1992,1991,1990,1989,1988,1987,1986,1985,1984,1983,1982,1981,1980,1979,1978,1977,1976,1975,1974,1973,1972,1971
Diese Statistik in anderen Ländern:
AfghanistanAlbaniaAlgeriaAmerican SamoaAndorraAngolaAntigua and BarbudaArab WorldArgentinaArmeniaAustraliaAustriaAzerbaijanBahamas, TheBahrainBangladeshBarbadosBelarusBelgiumBelizeBeninBermudaBhutanBoliviaBosnia and HerzegovinaBotswanaBrazilBrunei DarussalamBulgariaBurkina FasoBurundiCabo VerdeCambodiaCameroonCanadaCaribbean small statesCentral African RepublicCentral Europe and the BalticsChadChannel IslandsChileChinaColombiaComorosCongo, Dem. Rep.Congo, Rep.Costa RicaCote d'IvoireCroatiaCubaCyprusCzech RepublicDenmarkDjiboutiDominicaDominican RepublicEarly-demographic dividendEast Asia & PacificEast Asia & Pacific (excluding high income)East Asia & Pacific (IDA & IBRD countries)EcuadorEgypt, Arab Rep.El SalvadorEquatorial GuineaEritreaEstoniaEthiopiaEuro areaEurope & Central AsiaEurope & Central Asia (excluding high income)Europe & Central Asia (IDA & IBRD countries)European UnionFaroe IslandsFijiFinlandFragile and conflict affected situationsFranceFrench PolynesiaGabonGambia, TheGeorgiaGermanyGhanaGreeceGreenlandGrenadaGuatemalaGuineaGuinea-BissauGuyanaHaitiHeavily indebted poor countries (HIPC)High incomeHondurasHong Kong SAR, ChinaHungaryIBRD onlyIcelandIDA & IBRD totalIDA blendIDA onlyIDA totalIndiaIndonesiaIran, Islamic Rep.IraqIrelandIsle of ManIsraelItalyJamaicaJapanJordanKazakhstanKenyaKiribatiKorea, Rep.KosovoKuwaitKyrgyz RepublicLao PDRLate-demographic dividendLatin America & Caribbean Latin America & Caribbean (excluding high income)Latin America & the Caribbean (IDA & IBRD countries)LatviaLeast developed countries: UN classificationLebanonLesothoLiberiaLibyaLiechtensteinLithuaniaLow & middle incomeLow incomeLower middle incomeLuxembourgMacao SAR, ChinaMacedonia, FYRMadagascarMalawiMalaysiaMaldivesMaliMaltaMarshall IslandsMauritaniaMauritiusMexicoMicronesia, Fed. Sts.Middle East & North AfricaMiddle East & North Africa (excluding high income)Middle East & North Africa (IDA & IBRD countries)Middle incomeMoldovaMonacoMongoliaMontenegroMoroccoMozambiqueMyanmarNamibiaNepalNetherlandsNew CaledoniaNew ZealandNicaraguaNigerNigeriaNorth AmericaNorwayOECD membersOmanOther small statesPacific island small statesPakistanPalauPanamaPapua New GuineaParaguayPeruPhilippinesPolandPortugalPost-demographic dividendPre-demographic dividendPuerto RicoQatarRomaniaRussian FederationRwandaSamoaSan MarinoSao Tome and PrincipeSaudi ArabiaSenegalSerbiaSeychellesSierra LeoneSingaporeSlovak RepublicSloveniaSmall statesSolomon IslandsSomaliaSouth AfricaSouth AsiaSouth Asia (IDA & IBRD)South SudanSpainSri LankaSt. Kitts and NevisSt. LuciaSt. Vincent and the GrenadinesSub-Saharan Africa Sub-Saharan Africa (excluding high income)Sub-Saharan Africa (IDA & IBRD countries)SudanSurinameSwazilandSwedenSwitzerlandSyrian Arab RepublicTajikistanTanzaniaThailandTimor-LesteTogoTongaTrinidad and TobagoTunisiaTurkeyTurkmenistanTuvaluUgandaUkraineUnited Arab EmiratesUnited KingdomUnited StatesUpper middle incomeUruguayUzbekistanVanuatuVenezuela, RBVietnamVirgin Islands (U.S.)West Bank and GazaWorldYemen, Rep.ZambiaZimbabwe Zeitlinie:
Diese Zeitleiste vorliegt die Graphik ab 1971 J. bis 2015 J. India. Die Angaben bis 1970 J. sind nicht vorhanden. Die Zahl aktueller Beobachtungen nach Daten: 45.
Die Quelle (Bezeichnung):
Kennzahlen der Weltentwicklung
Die Quelle (Einrichtung):
World Bank staff estimates based on sources and methods in World Bank's "The Changing Wealth of Nations: Measuring Sustainable Development in the New Millennium" (2011).
Kategorien:
Economy & Growth, Energy & Mining, Environment
Es wurde aktualisiert:
23 Apr 2017 Jahr
Kennzahlen der Wertänderungen vom Jahr zum Jahr
Minimum:
0.085
1 Jan 1988 Jahr
Maximum:
1.464
1 Jan 2009 Jahr
Zum Datum der Beobachtung
Wert
Absolute Veränderung
Die Veränderung bezüglich dem vorherigen Wert
1 Jan 1971 Jahr
0.103
+0.103
0.0%
1 Jan 1972 Jahr
0.106
+0.002
2.27%
1 Jan 1973 Jahr
0.098
-0.007
-7.06%
1 Jan 1974 Jahr
0.088
-0.01
-10.45%
1 Jan 1975 Jahr
0.111
+0.024
26.85%
1 Jan 1976 Jahr
0.147
+0.036
32.39%
1 Jan 1977 Jahr
0.21
+0.063
42.51%
1 Jan 1978 Jahr
0.172
-0.038
-18.12%
1 Jan 1979 Jahr
0.115
-0.057
-33.06%
1 Jan 1980 Jahr
0.129
+0.014
11.75%
1 Jan 1981 Jahr
0.131
+0.002
1.44%
1 Jan 1982 Jahr
0.128
-0.003
-2.07%
1 Jan 1983 Jahr
0.154
+0.026
20.67%
1 Jan 1984 Jahr
0.111
-0.043
-27.77%
1 Jan 1985 Jahr
0.113
+0.002
1.5%
1 Jan 1986 Jahr
0.111
-0.002
-2.02%
1 Jan 1987 Jahr
0.106
-0.005
-4.14%
1 Jan 1988 Jahr
0.085
-0.021
-20.05%
1 Jan 1989 Jahr
0.113
+0.028
33.37%
1 Jan 1990 Jahr
0.146
+0.033
28.83%
1 Jan 1991 Jahr
0.137
-0.009
-5.9%
1 Jan 1992 Jahr
0.163
+0.026
18.96%
1 Jan 1993 Jahr
0.137
-0.027
-16.4%
1 Jan 1994 Jahr
0.116
-0.02
-14.96%
1 Jan 1995 Jahr
0.087
-0.03
-25.47%
1 Jan 1996 Jahr
0.086
-0.001
-1.06%
1 Jan 1997 Jahr
0.093
+0.007
8.49%
1 Jan 1998 Jahr
0.093
0.0
-0.15%
1 Jan 1999 Jahr
0.178
+0.085
91.82%
1 Jan 2000 Jahr
0.131
-0.047
-26.35%
1 Jan 2001 Jahr
0.158
+0.027
20.61%
1 Jan 2002 Jahr
0.146
-0.012
-7.74%
1 Jan 2003 Jahr
0.145
-0.001
-0.78%
1 Jan 2004 Jahr
0.154
+0.009
6.35%
1 Jan 2005 Jahr
0.203
+0.049
31.71%
1 Jan 2006 Jahr
0.478
+0.275
135.84%
1 Jan 2007 Jahr
0.656
+0.178
37.16%
1 Jan 2008 Jahr
1.152
+0.496
75.73%
1 Jan 2009 Jahr
1.464
+0.312
27.09%
1 Jan 2010 Jahr
0.629
-0.835
-57.02%
1 Jan 2011 Jahr
0.959
+0.33
52.4%
1 Jan 2012 Jahr
0.807
-0.152
-15.83%
1 Jan 2013 Jahr
0.434
-0.374
-46.28%
1 Jan 2014 Jahr
0.466
+0.032
7.39%
1 Jan 2015 Jahr
0.303
-0.162
-34.88%
Bewertung der Länder gemäß mit laufender Statistik nach Jahren


Kommentare: