29
/de/
de
AIzaSyAYiBZKx7MnpbEhh9jyipgxe19OcubqV5w
April 1, 2024
147096
Guinea-Bissau
GNB
true
2
1
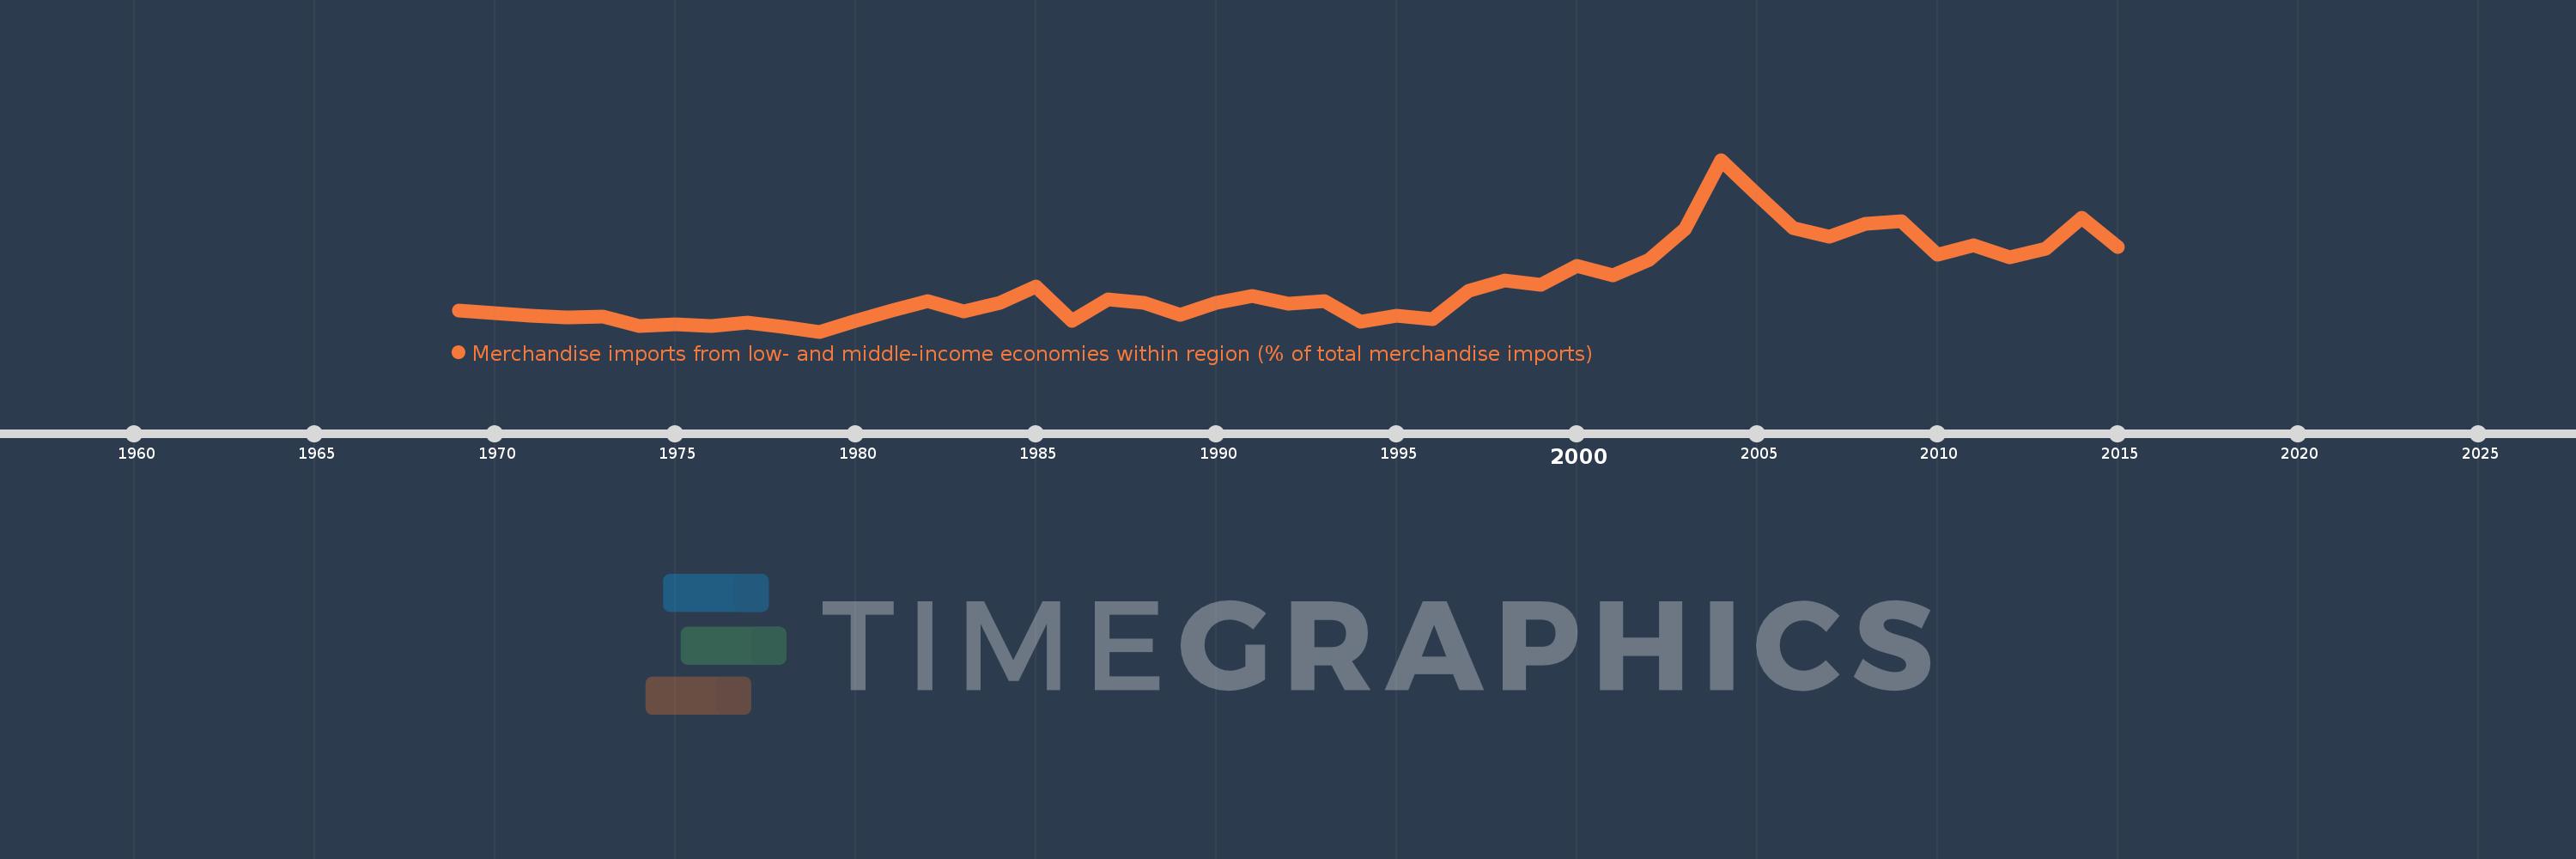
Merchandise imports from low- and middle-income economies within region (% of total merchandise imports)
2015,2014,2013,2012,2011,2010,2009,2008,2007,2006,2005,2004,2003,2002,2001,2000,1999,1998,1997,1996,1995,1994,1993,1992,1991,1990,1989,1988,1987,1986,1985,1984,1983,1982,1981,1980,1979,1978,1977,1976,1975,1974,1973,1972,1971,1969
Diese Statistik in anderen Ländern:
Zeitlinie:
Diese Zeitleiste vorliegt die Graphik ab 1969 J. bis 2015 J. Guinea-Bissau. Die Angaben bis 1968 J. sind nicht vorhanden. Die Zahl aktueller Beobachtungen nach Daten: 46.
Die Quelle (Bezeichnung):
Kennzahlen der Weltentwicklung
Die Quelle (Einrichtung):
World Bank staff estimates based data from International Monetary Fund's Direction of Trade database.
Kategorien:
Private Sector, Trade
Es wurde aktualisiert:
23 Apr 2017 Jahr
Kennzahlen der Wertänderungen vom Jahr zum Jahr
Minimum:
1.915
1 Jan 1979 Jahr
Maximum:
37.29
1 Jan 2004 Jahr
Zum Datum der Beobachtung
Wert
Absolute Veränderung
Die Veränderung bezüglich dem vorherigen Wert
1 Jan 1969 Jahr
6.25
+6.25
0.0%
1 Jan 1971 Jahr
5.147
-1.103
-17.65%
1 Jan 1972 Jahr
4.902
-0.245
-4.76%
1 Jan 1973 Jahr
5.0
+0.098
2.0%
1 Jan 1974 Jahr
3.044
-1.956
-39.11%
1 Jan 1975 Jahr
3.455
+0.41
13.47%
1 Jan 1976 Jahr
3.034
-0.421
-12.18%
1 Jan 1977 Jahr
3.725
+0.691
22.79%
1 Jan 1978 Jahr
2.953
-0.772
-20.72%
1 Jan 1979 Jahr
1.915
-1.038
-35.16%
1 Jan 1980 Jahr
4.171
+2.256
117.84%
1 Jan 1981 Jahr
6.217
+2.046
49.05%
1 Jan 1982 Jahr
8.204
+1.987
31.96%
1 Jan 1983 Jahr
5.989
-2.215
-27.0%
1 Jan 1984 Jahr
7.889
+1.9
31.73%
1 Jan 1985 Jahr
11.127
+3.238
41.04%
1 Jan 1986 Jahr
4.1
-7.027
-63.16%
1 Jan 1987 Jahr
8.467
+4.368
106.54%
1 Jan 1988 Jahr
7.782
-0.685
-8.09%
1 Jan 1989 Jahr
5.36
-2.422
-31.13%
1 Jan 1990 Jahr
7.837
+2.477
46.22%
1 Jan 1991 Jahr
9.307
+1.47
18.76%
1 Jan 1992 Jahr
7.595
-1.711
-18.39%
1 Jan 1993 Jahr
8.201
+0.605
7.97%
1 Jan 1994 Jahr
3.918
-4.283
-52.23%
1 Jan 1995 Jahr
5.225
+1.308
33.38%
1 Jan 1996 Jahr
4.506
-0.719
-13.76%
1 Jan 1997 Jahr
10.311
+5.805
128.82%
1 Jan 1998 Jahr
12.42
+2.108
20.45%
1 Jan 1999 Jahr
11.481
-0.939
-7.56%
1 Jan 2000 Jahr
15.383
+3.902
33.99%
1 Jan 2001 Jahr
13.588
-1.795
-11.67%
1 Jan 2002 Jahr
16.637
+3.049
22.44%
1 Jan 2003 Jahr
23.114
+6.477
38.93%
1 Jan 2004 Jahr
37.29
+14.175
61.33%
1 Jan 2005 Jahr
30.137
-7.152
-19.18%
1 Jan 2006 Jahr
23.295
-6.842
-22.7%
1 Jan 2007 Jahr
21.478
-1.818
-7.8%
1 Jan 2008 Jahr
24.091
+2.613
12.17%
1 Jan 2009 Jahr
24.646
+0.555
2.3%
1 Jan 2010 Jahr
17.804
-6.842
-27.76%
1 Jan 2011 Jahr
19.718
+1.914
10.75%
1 Jan 2012 Jahr
17.202
-2.516
-12.76%
1 Jan 2013 Jahr
18.985
+1.783
10.36%
1 Jan 2014 Jahr
25.326
+6.341
33.4%
1 Jan 2015 Jahr
19.316
-6.01
-23.73%
Bewertung der Länder gemäß mit laufender Statistik nach Jahren


Kommentare: