29
/de/
de
AIzaSyAYiBZKx7MnpbEhh9jyipgxe19OcubqV5w
April 1, 2024
139907
Germany
DEU
true
2
1
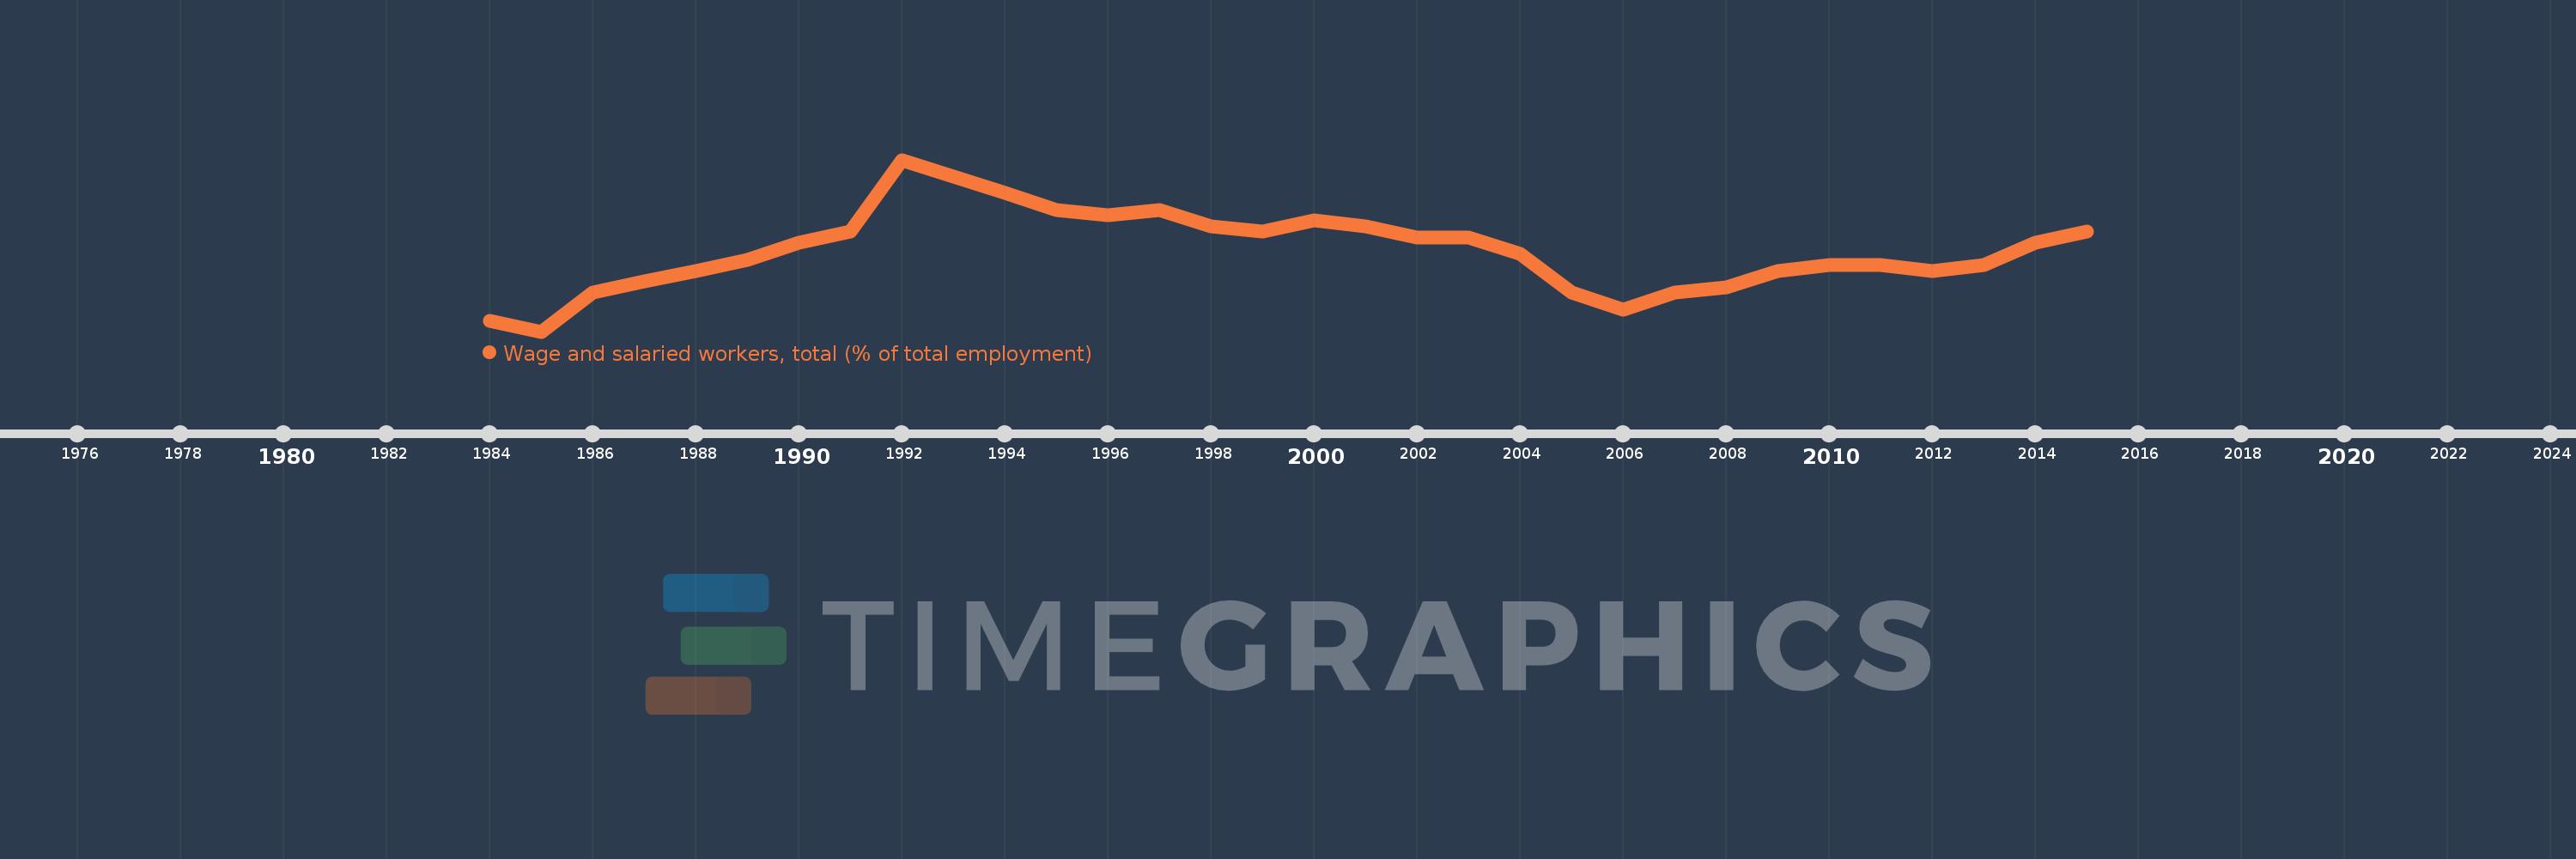
Wage and salaried workers, total (% of total employment)
2015,2014,2013,2012,2011,2010,2009,2008,2007,2006,2005,2004,2003,2002,2001,2000,1999,1998,1997,1996,1995,1994,1993,1992,1991,1990,1989,1988,1987,1986,1985,1984
Diese Statistik in anderen Ländern:
AlbaniaAlgeriaAmerican SamoaAngolaAntigua and BarbudaArgentinaArmeniaArubaAustraliaAustriaAzerbaijanBahamas, TheBahrainBangladeshBarbadosBelarusBelgiumBelizeBeninBermudaBhutanBoliviaBosnia and HerzegovinaBotswanaBrazilBritish Virgin IslandsBrunei DarussalamBulgariaBurkina FasoBurundiCabo VerdeCambodiaCameroonCanadaCaribbean small statesCayman IslandsCentral Europe and the BalticsChadChileChinaColombiaCongo, Rep.Costa RicaCote d'IvoireCroatiaCubaCyprusCzech RepublicDenmarkDjiboutiDominicaDominican RepublicEarly-demographic dividendEast Asia & PacificEast Asia & Pacific (excluding high income)East Asia & Pacific (IDA & IBRD countries)EcuadorEgypt, Arab Rep.El SalvadorEquatorial GuineaEstoniaEthiopiaEuro areaEurope & Central AsiaEurope & Central Asia (excluding high income)Europe & Central Asia (IDA & IBRD countries)European UnionFijiFinlandFranceFrench PolynesiaGabonGambia, TheGeorgiaGermanyGhanaGreeceGrenadaGuamGuatemalaGuineaGuyanaHaitiHigh incomeHondurasHong Kong SAR, ChinaHungaryIBRD onlyIcelandIDA & IBRD totalIndiaIndonesiaIran, Islamic Rep.IrelandIsle of ManIsraelItalyJamaicaJapanJordanKazakhstanKenyaKiribatiKorea, Rep.KosovoKuwaitKyrgyz RepublicLao PDRLate-demographic dividendLatin America & Caribbean Latin America & Caribbean (excluding high income)Latin America & the Caribbean (IDA & IBRD countries)LatviaLebanonLesothoLiberiaLithuaniaLow & middle incomeLower middle incomeLuxembourgMacao SAR, ChinaMacedonia, FYRMadagascarMalawiMalaysiaMaldivesMaliMaltaMarshall IslandsMauritiusMexicoMiddle East & North AfricaMiddle East & North Africa (excluding high income)Middle East & North Africa (IDA & IBRD countries)Middle incomeMoldovaMongoliaMontenegroMoroccoMozambiqueNamibiaNepalNetherlandsNew CaledoniaNew ZealandNicaraguaNigerNorth AmericaNorwayOECD membersOmanPakistanPanamaParaguayPeruPhilippinesPolandPortugalPost-demographic dividendPuerto RicoQatarRomaniaRussian FederationRwandaSamoaSan MarinoSao Tome and PrincipeSaudi ArabiaSenegalSerbiaSeychellesSierra LeoneSingaporeSlovak RepublicSloveniaSouth AfricaSouth AsiaSouth Asia (IDA & IBRD)SpainSri LankaSt. Kitts and NevisSt. LuciaSt. Vincent and the GrenadinesSurinameSwazilandSwedenSwitzerlandSyrian Arab RepublicTajikistanTanzaniaThailandTimor-LesteTogoTongaTrinidad and TobagoTunisiaTurkeyTurks and Caicos IslandsTuvaluUgandaUkraineUnited Arab EmiratesUnited KingdomUnited StatesUpper middle incomeUruguayVanuatuVenezuela, RBVietnamWest Bank and GazaWorldYemen, Rep.ZambiaZimbabwe Zeitlinie:
Diese Zeitleiste vorliegt die Graphik ab 1984 J. bis 2015 J. Germany. Die Angaben bis 1983 J. sind nicht vorhanden. Die Zahl aktueller Beobachtungen nach Daten: 32.
Die Quelle (Bezeichnung):
Kennzahlen der Weltentwicklung
Die Quelle (Einrichtung):
International Labour Organization, Key Indicators of the Labour Market database.
Kategorien:
Social Protection & Labor
Es wurde aktualisiert:
23 Apr 2017 Jahr
Kennzahlen der Wertänderungen vom Jahr zum Jahr
Minimum:
87.2
1 Jan 1985 Jahr
Maximum:
90.3
1 Jan 1992 Jahr
Zum Datum der Beobachtung
Wert
Absolute Veränderung
Die Veränderung bezüglich dem vorherigen Wert
1 Jan 1984 Jahr
87.4
+87.4
0.0%
1 Jan 1985 Jahr
87.2
-0.2
-0.23%
1 Jan 1986 Jahr
87.9
+0.7
0.8%
1 Jan 1987 Jahr
88.1
+0.2
0.23%
1 Jan 1988 Jahr
88.3
+0.2
0.23%
1 Jan 1989 Jahr
88.5
+0.2
0.23%
1 Jan 1990 Jahr
88.8
+0.3
0.34%
1 Jan 1991 Jahr
89.0
+0.2
0.23%
1 Jan 1992 Jahr
90.3
+1.3
1.46%
1 Jan 1993 Jahr
90.0
-0.3
-0.33%
1 Jan 1994 Jahr
89.7
-0.3
-0.33%
1 Jan 1995 Jahr
89.4
-0.3
-0.33%
1 Jan 1996 Jahr
89.3
-0.1
-0.11%
1 Jan 1997 Jahr
89.4
+0.1
0.11%
1 Jan 1998 Jahr
89.1
-0.3
-0.34%
1 Jan 1999 Jahr
89.0
-0.1
-0.11%
1 Jan 2000 Jahr
89.2
+0.2
0.22%
1 Jan 2001 Jahr
89.1
-0.1
-0.11%
1 Jan 2002 Jahr
88.9
-0.2
-0.22%
1 Jan 2003 Jahr
88.9
0.0
0.0%
1 Jan 2004 Jahr
88.6
-0.3
-0.34%
1 Jan 2005 Jahr
87.9
-0.7
-0.79%
1 Jan 2006 Jahr
87.6
-0.3
-0.34%
1 Jan 2007 Jahr
87.9
+0.3
0.34%
1 Jan 2008 Jahr
88.0
+0.1
0.11%
1 Jan 2009 Jahr
88.3
+0.3
0.34%
1 Jan 2010 Jahr
88.4
+0.1
0.11%
1 Jan 2011 Jahr
88.4
0.0
0.0%
1 Jan 2012 Jahr
88.3
-0.1
-0.11%
1 Jan 2013 Jahr
88.4
+0.1
0.11%
1 Jan 2014 Jahr
88.8
+0.4
0.45%
1 Jan 2015 Jahr
89.0
+0.2
0.23%
Bewertung der Länder gemäß mit laufender Statistik nach Jahren


Kommentare: