29
/de/
de
AIzaSyAYiBZKx7MnpbEhh9jyipgxe19OcubqV5w
April 1, 2024
139729
Germany
DEU
true
2
1
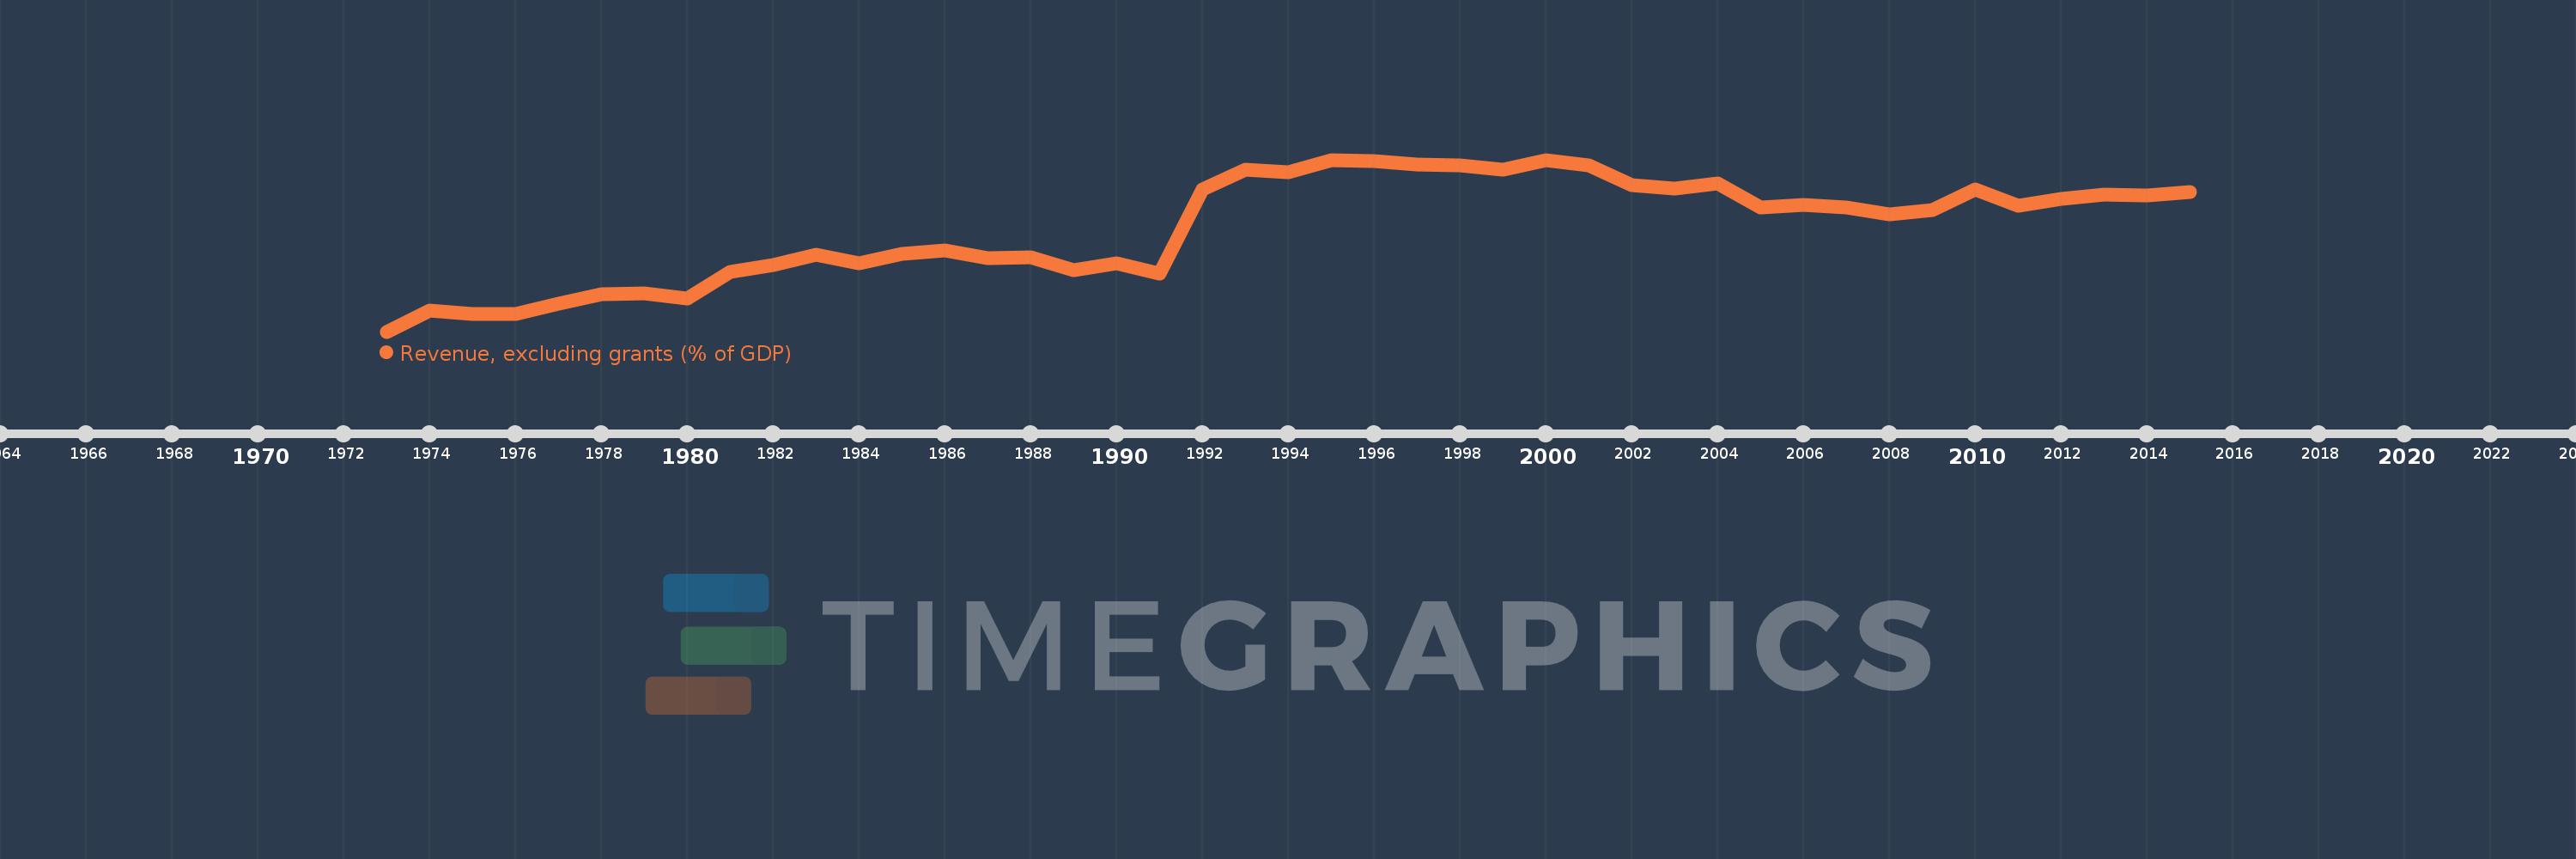
Revenue, excluding grants (% of GDP)
2015,2014,2013,2012,2011,2010,2009,2008,2007,2006,2005,2004,2003,2002,2001,2000,1999,1998,1997,1996,1995,1994,1993,1992,1991,1990,1989,1988,1987,1986,1985,1984,1983,1982,1981,1980,1979,1978,1977,1976,1975,1974,1973
Diese Statistik in anderen Ländern:
AfghanistanAlbaniaAlgeriaAngolaAntigua and BarbudaArgentinaArmeniaAustraliaAustriaAzerbaijanBahamas, TheBahrainBangladeshBarbadosBelarusBelgiumBelizeBeninBhutanBoliviaBosnia and HerzegovinaBotswanaBrazilBulgariaBurkina FasoBurundiCabo VerdeCambodiaCanadaCaribbean small statesCentral African RepublicCentral Europe and the BalticsChileChinaColombiaCongo, Dem. Rep.Congo, Rep.Costa RicaCote d'IvoireCroatiaCyprusCzech RepublicDenmarkDominicaDominican RepublicEarly-demographic dividendEast Asia & PacificEast Asia & Pacific (excluding high income)East Asia & Pacific (IDA & IBRD countries)Egypt, Arab Rep.El SalvadorEquatorial GuineaEstoniaEthiopiaEuro areaEurope & Central AsiaEurope & Central Asia (excluding high income)Europe & Central Asia (IDA & IBRD countries)European UnionFijiFinlandFranceGambia, TheGeorgiaGermanyGhanaGreeceGrenadaGuatemalaHeavily indebted poor countries (HIPC)High incomeHondurasHong Kong SAR, ChinaHungaryIBRD onlyIcelandIDA & IBRD totalIDA blendIDA onlyIDA totalIndiaIndonesiaIran, Islamic Rep.IraqIrelandIsraelItalyJamaicaJapanJordanKazakhstanKenyaKiribatiKorea, Rep.KuwaitKyrgyz RepublicLao PDRLate-demographic dividendLatin America & Caribbean Latin America & Caribbean (excluding high income)Latin America & the Caribbean (IDA & IBRD countries)LatviaLeast developed countries: UN classificationLebanonLesothoLiberiaLithuaniaLow & middle incomeLow incomeLower middle incomeLuxembourgMacao SAR, ChinaMacedonia, FYRMadagascarMalawiMalaysiaMaldivesMaliMaltaMauritiusMexicoMicronesia, Fed. Sts.Middle East & North Africa (excluding high income)Middle East & North Africa (IDA & IBRD countries)Middle incomeMoldovaMongoliaMoroccoMozambiqueMyanmarNamibiaNepalNetherlandsNew ZealandNicaraguaNigeriaNorth AmericaNorwayOECD membersOmanOther small statesPacific island small statesPakistanPanamaPapua New GuineaParaguayPeruPhilippinesPolandPortugalPost-demographic dividendPre-demographic dividendQatarRomaniaRussian FederationRwandaSamoaSan MarinoSao Tome and PrincipeSenegalSerbiaSeychellesSierra LeoneSingaporeSlovak RepublicSloveniaSmall statesSolomon IslandsSouth AfricaSouth AsiaSouth Asia (IDA & IBRD)SpainSri LankaSt. Kitts and NevisSt. LuciaSt. Vincent and the GrenadinesSub-Saharan Africa Sub-Saharan Africa (excluding high income)Sub-Saharan Africa (IDA & IBRD countries)SurinameSwazilandSwedenSwitzerlandSyrian Arab RepublicTajikistanTanzaniaThailandTimor-LesteTogoTrinidad and TobagoTunisiaTurkeyUgandaUkraineUnited Arab EmiratesUnited KingdomUnited StatesUpper middle incomeUruguayVanuatuVenezuela, RBVietnamWest Bank and GazaWorldYemen, Rep.ZambiaZimbabwe Zeitlinie:
Diese Zeitleiste vorliegt die Graphik ab 1973 J. bis 2015 J. Germany. Die Angaben bis 1972 J. sind nicht vorhanden. Die Zahl aktueller Beobachtungen nach Daten: 43.
Die Quelle (Bezeichnung):
Kennzahlen der Weltentwicklung
Die Quelle (Einrichtung):
International Monetary Fund, Government Finance Statistics Yearbook and data files, and World Bank and OECD GDP estimates.
Kategorien:
Economy & Growth, Public Sector
Es wurde aktualisiert:
23 Apr 2017 Jahr
Kennzahlen der Wertänderungen vom Jahr zum Jahr
Minimum:
21.627
1 Jan 1973 Jahr
Maximum:
30.145
1 Jan 2000 Jahr
Zum Datum der Beobachtung
Wert
Absolute Veränderung
Die Veränderung bezüglich dem vorherigen Wert
1 Jan 1973 Jahr
21.627
+21.627
0.0%
1 Jan 1974 Jahr
22.659
+1.032
4.77%
1 Jan 1975 Jahr
22.506
-0.153
-0.68%
1 Jan 1976 Jahr
22.516
+0.01
0.05%
1 Jan 1977 Jahr
23.001
+0.485
2.15%
1 Jan 1978 Jahr
23.459
+0.457
1.99%
1 Jan 1979 Jahr
23.528
+0.07
0.3%
1 Jan 1980 Jahr
23.27
-0.258
-1.1%
1 Jan 1981 Jahr
24.591
+1.32
5.67%
1 Jan 1982 Jahr
24.934
+0.343
1.39%
1 Jan 1983 Jahr
25.449
+0.515
2.07%
1 Jan 1984 Jahr
25.025
-0.423
-1.66%
1 Jan 1985 Jahr
25.489
+0.463
1.85%
1 Jan 1986 Jahr
25.652
+0.163
0.64%
1 Jan 1987 Jahr
25.287
-0.365
-1.42%
1 Jan 1988 Jahr
25.32
+0.034
0.13%
1 Jan 1989 Jahr
24.665
-0.656
-2.59%
1 Jan 1990 Jahr
25.0
+0.335
1.36%
1 Jan 1991 Jahr
24.502
-0.498
-1.99%
1 Jan 1992 Jahr
28.685
+4.183
17.07%
1 Jan 1993 Jahr
29.652
+0.968
3.37%
1 Jan 1994 Jahr
29.524
-0.128
-0.43%
1 Jan 1995 Jahr
30.136
+0.612
2.07%
1 Jan 1996 Jahr
30.09
-0.046
-0.15%
1 Jan 1997 Jahr
29.895
-0.196
-0.65%
1 Jan 1998 Jahr
29.862
-0.033
-0.11%
1 Jan 1999 Jahr
29.67
-0.192
-0.64%
1 Jan 2000 Jahr
30.145
+0.475
1.6%
1 Jan 2001 Jahr
29.848
-0.297
-0.99%
1 Jan 2002 Jahr
28.902
-0.946
-3.17%
1 Jan 2003 Jahr
28.709
-0.194
-0.67%
1 Jan 2004 Jahr
28.966
+0.257
0.9%
1 Jan 2005 Jahr
27.785
-1.181
-4.08%
1 Jan 2006 Jahr
27.927
+0.142
0.51%
1 Jan 2007 Jahr
27.766
-0.161
-0.58%
1 Jan 2008 Jahr
27.45
-0.316
-1.14%
1 Jan 2009 Jahr
27.667
+0.217
0.79%
1 Jan 2010 Jahr
28.686
+1.02
3.69%
1 Jan 2011 Jahr
27.848
-0.838
-2.92%
1 Jan 2012 Jahr
28.226
+0.377
1.35%
1 Jan 2013 Jahr
28.424
+0.198
0.7%
1 Jan 2014 Jahr
28.375
-0.048
-0.17%
1 Jan 2015 Jahr
28.546
+0.171
0.6%
Bewertung der Länder gemäß mit laufender Statistik nach Jahren


Kommentare: