29
/de/
de
AIzaSyAYiBZKx7MnpbEhh9jyipgxe19OcubqV5w
April 1, 2024
139694
Germany
DEU
true
2
1
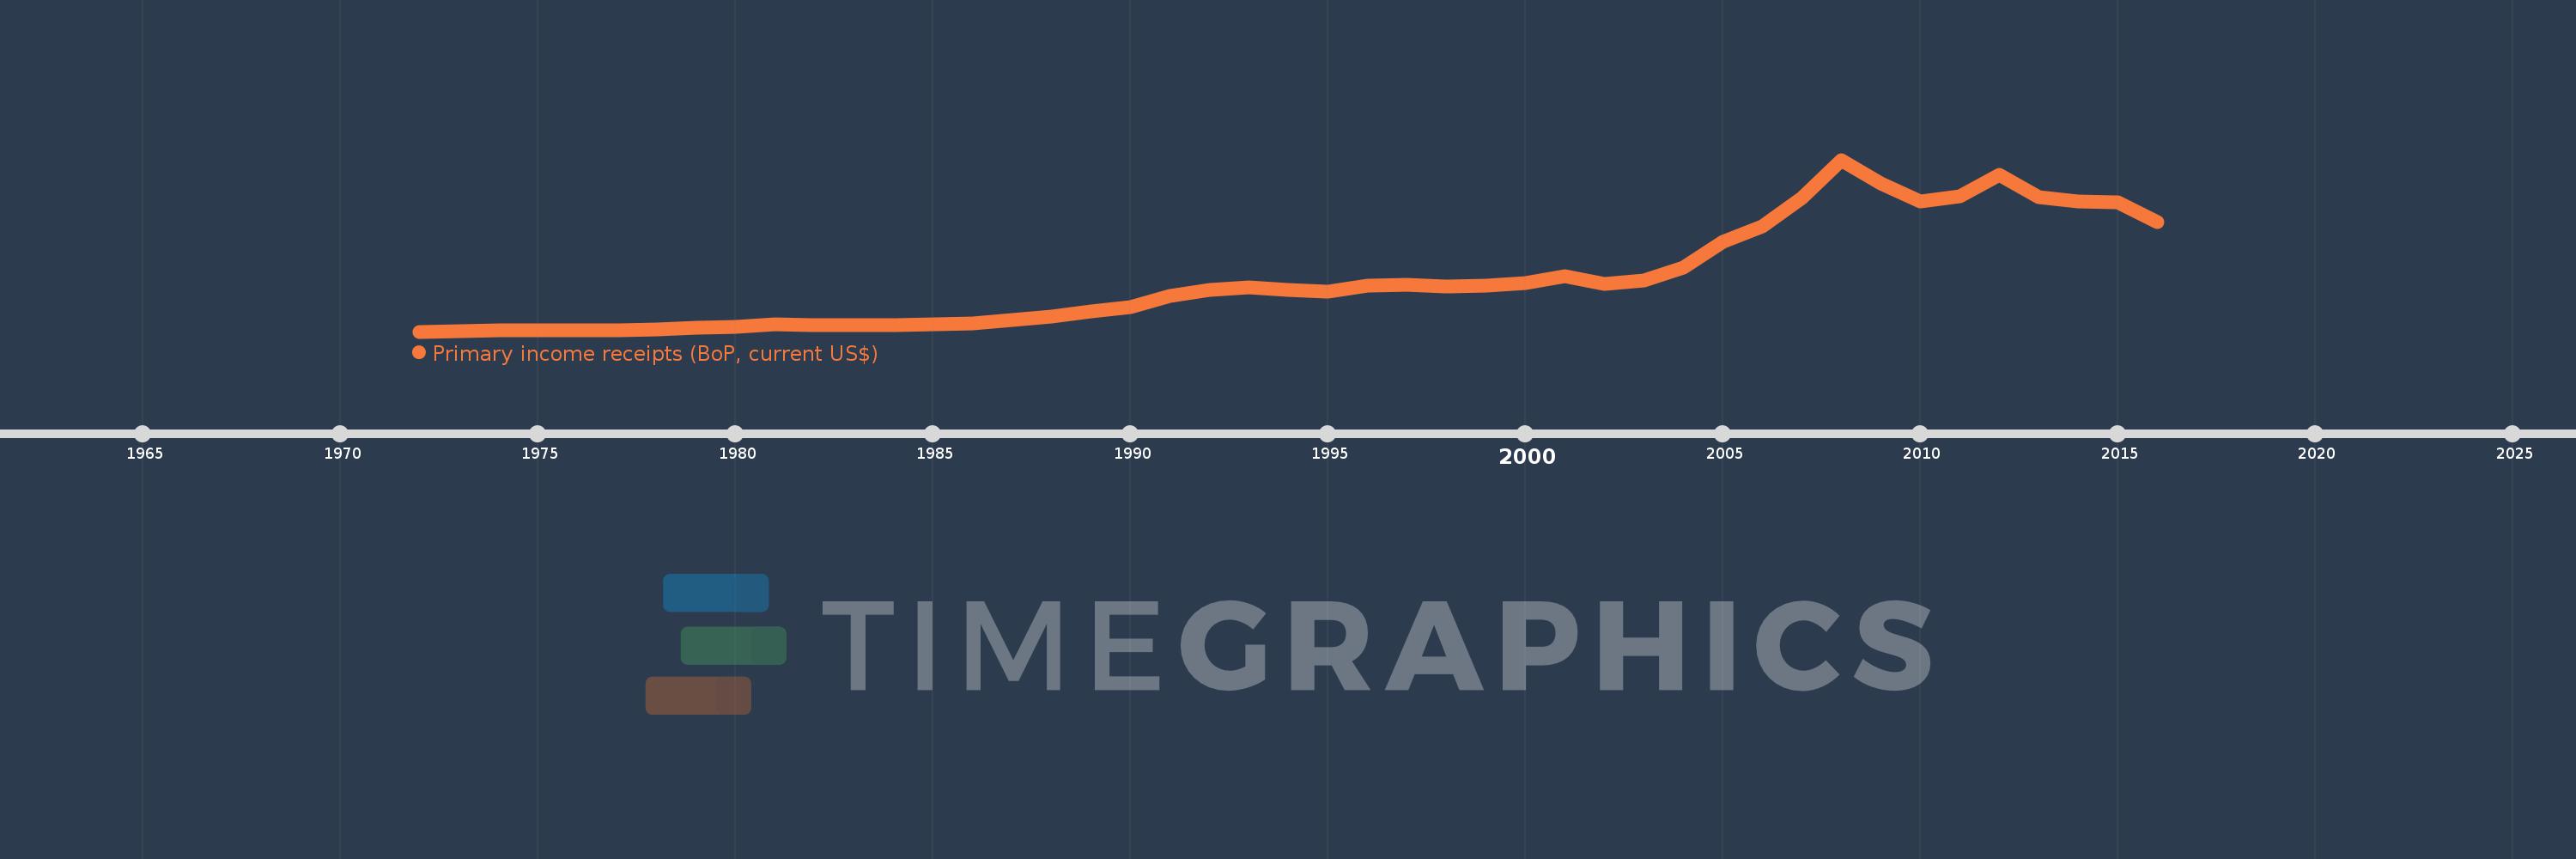
Primary income receipts (BoP, current US$)
2016,2015,2014,2013,2012,2011,2010,2009,2008,2007,2006,2005,2004,2003,2002,2001,2000,1999,1998,1997,1996,1995,1994,1993,1992,1991,1990,1989,1988,1987,1986,1985,1984,1983,1982,1981,1980,1979,1978,1977,1976,1975,1974,1973,1972
Diese Statistik in anderen Ländern:
AfghanistanAlbaniaAlgeriaAngolaAntigua and BarbudaArab WorldArgentinaArmeniaArubaAustraliaAustriaAzerbaijanBahamas, TheBahrainBangladeshBarbadosBelarusBelgiumBelizeBeninBermudaBhutanBoliviaBosnia and HerzegovinaBotswanaBrazilBrunei DarussalamBulgariaBurkina FasoBurundiCabo VerdeCambodiaCameroonCanadaCaribbean small statesCentral African RepublicCentral Europe and the BalticsChadChileChinaColombiaComorosCongo, Dem. Rep.Congo, Rep.Costa RicaCote d'IvoireCroatiaCuracaoCyprusCzech RepublicDenmarkDjiboutiDominicaDominican RepublicEarly-demographic dividendEast Asia & PacificEast Asia & Pacific (excluding high income)East Asia & Pacific (IDA & IBRD countries)EcuadorEgypt, Arab Rep.El SalvadorEquatorial GuineaEritreaEstoniaEthiopiaEuro areaEurope & Central AsiaEurope & Central Asia (excluding high income)Europe & Central Asia (IDA & IBRD countries)European UnionFaroe IslandsFijiFinlandFragile and conflict affected situationsFranceFrench PolynesiaGabonGambia, TheGeorgiaGermanyGhanaGreeceGrenadaGuatemalaGuineaGuinea-BissauGuyanaHaitiHeavily indebted poor countries (HIPC)High incomeHondurasHong Kong SAR, ChinaHungaryIBRD onlyIcelandIDA & IBRD totalIDA blendIDA onlyIDA totalIndiaIndonesiaIran, Islamic Rep.IraqIrelandIsraelItalyJamaicaJapanJordanKazakhstanKenyaKiribatiKorea, Rep.KosovoKuwaitKyrgyz RepublicLao PDRLate-demographic dividendLatin America & Caribbean Latin America & Caribbean (excluding high income)Latin America & the Caribbean (IDA & IBRD countries)LatviaLeast developed countries: UN classificationLebanonLesothoLiberiaLibyaLithuaniaLow & middle incomeLow incomeLower middle incomeLuxembourgMacao SAR, ChinaMacedonia, FYRMadagascarMalawiMalaysiaMaldivesMaliMaltaMarshall IslandsMauritaniaMauritiusMexicoMicronesia, Fed. Sts.Middle East & North AfricaMiddle East & North Africa (excluding high income)Middle East & North Africa (IDA & IBRD countries)Middle incomeMoldovaMongoliaMontenegroMoroccoMozambiqueMyanmarNamibiaNepalNetherlandsNew CaledoniaNew ZealandNicaraguaNigerNigeriaNorth AmericaNorwayOECD membersOmanOther small statesPacific island small statesPakistanPalauPanamaPapua New GuineaParaguayPeruPhilippinesPolandPortugalPost-demographic dividendPre-demographic dividendQatarRomaniaRussian FederationRwandaSamoaSao Tome and PrincipeSaudi ArabiaSenegalSerbiaSeychellesSierra LeoneSingaporeSint Maarten (Dutch part)Slovak RepublicSloveniaSmall statesSolomon IslandsSouth AfricaSouth AsiaSouth Asia (IDA & IBRD)South SudanSpainSri LankaSt. Kitts and NevisSt. LuciaSt. Vincent and the GrenadinesSub-Saharan Africa Sub-Saharan Africa (excluding high income)Sub-Saharan Africa (IDA & IBRD countries)SudanSurinameSwazilandSwedenSwitzerlandSyrian Arab RepublicTajikistanTanzaniaThailandTimor-LesteTogoTongaTrinidad and TobagoTunisiaTurkeyTuvaluUgandaUkraineUnited KingdomUnited StatesUpper middle incomeUruguayVanuatuVenezuela, RBVietnamWest Bank and GazaWorldYemen, Rep.ZambiaZimbabwe Zeitlinie:
Diese Zeitleiste vorliegt die Graphik ab 1972 J. bis 2016 J. Germany. Die Angaben bis 1971 J. sind nicht vorhanden. Die Zahl aktueller Beobachtungen nach Daten: 45.
Die Quelle (Bezeichnung):
Kennzahlen der Weltentwicklung
Die Quelle (Einrichtung):
International Monetary Fund, Balance of Payments Statistics Yearbook and data files.
Kategorien:
Economy & Growth
Es wurde aktualisiert:
23 Apr 2017 Jahr
Kennzahlen der Wertänderungen vom Jahr zum Jahr
im Durchschnitt:
104.41 Mlrd.
Minimum:
2.68 Mlrd.
1 Jan 1972 Jahr
Maximum:
336.391 Mlrd.
1 Jan 2008 Jahr
Zum Datum der Beobachtung
Wert
Absolute Veränderung
Die Veränderung bezüglich dem vorherigen Wert
1 Jan 1972 Jahr
2.68 Mlrd.
+2.68 Mlrd.
0.0%
1 Jan 1973 Jahr
3.15 Mlrd.
+469.654 Mln.
17.52%
1 Jan 1974 Jahr
4.391 Mlrd.
+1.241 Mlrd.
39.4%
1 Jan 1975 Jahr
5.348 Mlrd.
+956.573 Mln.
21.78%
1 Jan 1976 Jahr
5.493 Mlrd.
+144.751 Mln.
2.71%
1 Jan 1977 Jahr
5.99 Mlrd.
+497.85 Mln.
9.06%
1 Jan 1978 Jahr
6.459 Mlrd.
+468.319 Mln.
7.82%
1 Jan 1979 Jahr
9.493 Mlrd.
+3.035 Mlrd.
46.98%
1 Jan 1980 Jahr
12.065 Mlrd.
+2.572 Mlrd.
27.09%
1 Jan 1981 Jahr
16.663 Mlrd.
+4.597 Mlrd.
38.1%
1 Jan 1982 Jahr
15.739 Mlrd.
-923.921 Mln.
-5.54%
1 Jan 1983 Jahr
15.251 Mlrd.
-487.841 Mln.
-3.1%
1 Jan 1984 Jahr
15.564 Mlrd.
+313.471 Mln.
2.06%
1 Jan 1985 Jahr
16.881 Mlrd.
+1.316 Mlrd.
8.46%
1 Jan 1986 Jahr
17.845 Mlrd.
+964.642 Mln.
5.71%
1 Jan 1987 Jahr
25.2 Mlrd.
+7.355 Mlrd.
41.21%
1 Jan 1988 Jahr
32.443 Mlrd.
+7.243 Mlrd.
28.74%
1 Jan 1989 Jahr
42.695 Mlrd.
+10.252 Mlrd.
31.6%
1 Jan 1990 Jahr
49.66 Mlrd.
+6.965 Mlrd.
16.31%
1 Jan 1991 Jahr
71.783 Mlrd.
+22.123 Mlrd.
44.55%
1 Jan 1992 Jahr
82.847 Mlrd.
+11.065 Mlrd.
15.41%
1 Jan 1993 Jahr
89.021 Mlrd.
+6.173 Mlrd.
7.45%
1 Jan 1994 Jahr
83.548 Mlrd.
-5.473 Mlrd.
-6.15%
1 Jan 1995 Jahr
79.976 Mlrd.
-3.572 Mlrd.
-4.28%
1 Jan 1996 Jahr
92.535 Mlrd.
+12.559 Mlrd.
15.7%
1 Jan 1997 Jahr
93.035 Mlrd.
+499.709 Mln.
0.54%
1 Jan 1998 Jahr
90.028 Mlrd.
-3.007 Mlrd.
-3.23%
1 Jan 1999 Jahr
91.427 Mlrd.
+1.4 Mlrd.
1.55%
1 Jan 2000 Jahr
97.381 Mlrd.
+5.953 Mlrd.
6.51%
1 Jan 2001 Jahr
110.721 Mlrd.
+13.341 Mlrd.
13.7%
1 Jan 2002 Jahr
94.591 Mlrd.
-16.13 Mlrd.
-14.57%
1 Jan 2003 Jahr
101.717 Mlrd.
+7.126 Mlrd.
7.53%
1 Jan 2004 Jahr
126.514 Mlrd.
+24.797 Mlrd.
24.38%
1 Jan 2005 Jahr
177.172 Mlrd.
+50.657 Mlrd.
40.04%
1 Jan 2006 Jahr
207.859 Mlrd.
+30.687 Mlrd.
17.32%
1 Jan 2007 Jahr
262.487 Mlrd.
+54.628 Mlrd.
26.28%
1 Jan 2008 Jahr
336.391 Mlrd.
+73.904 Mlrd.
28.16%
1 Jan 2009 Jahr
290.613 Mlrd.
-45.778 Mlrd.
-13.61%
1 Jan 2010 Jahr
255.478 Mlrd.
-35.136 Mlrd.
-12.09%
1 Jan 2011 Jahr
264.984 Mlrd.
+9.506 Mlrd.
3.72%
1 Jan 2012 Jahr
306.418 Mlrd.
+41.434 Mlrd.
15.64%
1 Jan 2013 Jahr
263.218 Mlrd.
-43.2 Mlrd.
-14.1%
1 Jan 2014 Jahr
255.859 Mlrd.
-7.359 Mlrd.
-2.8%
1 Jan 2015 Jahr
253.827 Mlrd.
-2.032 Mlrd.
-0.79%
1 Jan 2016 Jahr
216.006 Mlrd.
-37.821 Mlrd.
-14.9%
Bewertung der Länder gemäß mit laufender Statistik nach Jahren


Kommentare: