29
/de/
de
AIzaSyAYiBZKx7MnpbEhh9jyipgxe19OcubqV5w
April 1, 2024
139391
Germany
DEU
true
2
1
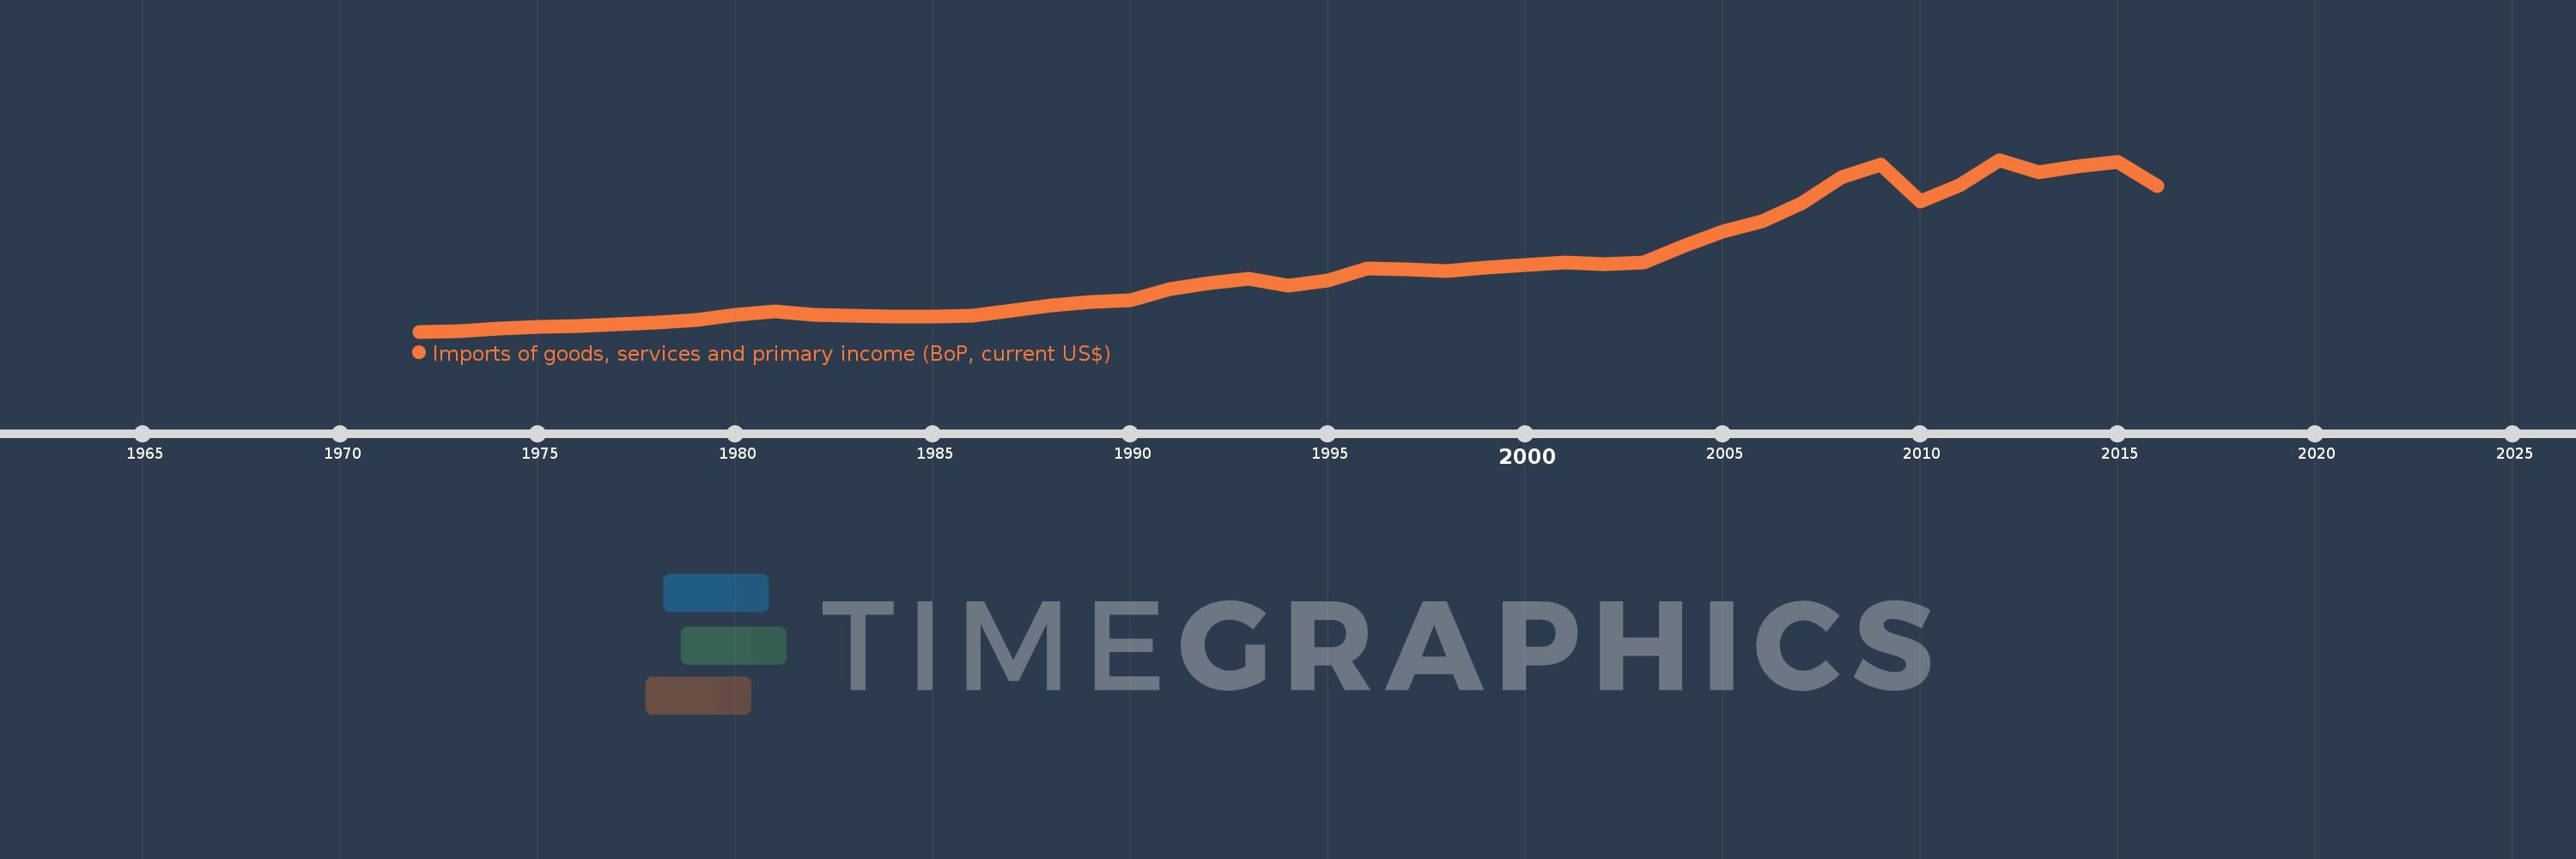
Imports of goods, services and primary income (BoP, current US$)
2016,2015,2014,2013,2012,2011,2010,2009,2008,2007,2006,2005,2004,2003,2002,2001,2000,1999,1998,1997,1996,1995,1994,1993,1992,1991,1990,1989,1988,1987,1986,1985,1984,1983,1982,1981,1980,1979,1978,1977,1976,1975,1974,1973,1972
Diese Statistik in anderen Ländern:
AfghanistanAlbaniaAlgeriaAngolaAntigua and BarbudaArab WorldArgentinaArmeniaArubaAustraliaAustriaAzerbaijanBahamas, TheBahrainBangladeshBarbadosBelarusBelgiumBelizeBeninBermudaBhutanBoliviaBosnia and HerzegovinaBotswanaBrazilBrunei DarussalamBulgariaBurkina FasoBurundiCabo VerdeCambodiaCameroonCanadaCaribbean small statesCentral African RepublicCentral Europe and the BalticsChadChileChinaColombiaComorosCongo, Dem. Rep.Congo, Rep.Costa RicaCote d'IvoireCroatiaCuracaoCyprusCzech RepublicDenmarkDjiboutiDominicaDominican RepublicEarly-demographic dividendEast Asia & PacificEast Asia & Pacific (excluding high income)East Asia & Pacific (IDA & IBRD countries)EcuadorEgypt, Arab Rep.El SalvadorEquatorial GuineaEritreaEstoniaEthiopiaEuro areaEurope & Central AsiaEurope & Central Asia (excluding high income)Europe & Central Asia (IDA & IBRD countries)European UnionFaroe IslandsFijiFinlandFragile and conflict affected situationsFranceFrench PolynesiaGabonGambia, TheGeorgiaGermanyGhanaGreeceGrenadaGuatemalaGuineaGuinea-BissauGuyanaHaitiHeavily indebted poor countries (HIPC)High incomeHondurasHong Kong SAR, ChinaHungaryIBRD onlyIcelandIDA & IBRD totalIDA blendIDA onlyIDA totalIndiaIndonesiaIran, Islamic Rep.IraqIrelandIsraelItalyJamaicaJapanJordanKazakhstanKenyaKiribatiKorea, Rep.KosovoKuwaitKyrgyz RepublicLao PDRLate-demographic dividendLatin America & Caribbean Latin America & Caribbean (excluding high income)Latin America & the Caribbean (IDA & IBRD countries)LatviaLeast developed countries: UN classificationLebanonLesothoLiberiaLibyaLithuaniaLow & middle incomeLow incomeLower middle incomeLuxembourgMacao SAR, ChinaMacedonia, FYRMadagascarMalawiMalaysiaMaldivesMaliMaltaMarshall IslandsMauritaniaMauritiusMexicoMicronesia, Fed. Sts.Middle East & North Africa (excluding high income)Middle East & North Africa (IDA & IBRD countries)Middle incomeMoldovaMongoliaMontenegroMoroccoMozambiqueMyanmarNamibiaNepalNetherlandsNew CaledoniaNicaraguaNigerNigeriaNorth AmericaNorwayOECD membersOmanOther small statesPacific island small statesPakistanPalauPanamaPapua New GuineaParaguayPeruPhilippinesPolandPortugalPost-demographic dividendPre-demographic dividendQatarRomaniaRussian FederationRwandaSamoaSao Tome and PrincipeSaudi ArabiaSenegalSerbiaSeychellesSierra LeoneSingaporeSint Maarten (Dutch part)Slovak RepublicSloveniaSmall statesSolomon IslandsSouth AfricaSouth AsiaSouth Asia (IDA & IBRD)South SudanSpainSri LankaSt. Kitts and NevisSt. LuciaSt. Vincent and the GrenadinesSub-Saharan Africa Sub-Saharan Africa (excluding high income)Sub-Saharan Africa (IDA & IBRD countries)SudanSurinameSwazilandSwedenSwitzerlandSyrian Arab RepublicTajikistanTanzaniaThailandTimor-LesteTogoTongaTrinidad and TobagoTunisiaTurkeyTuvaluUgandaUkraineUnited KingdomUnited StatesUpper middle incomeUruguayVanuatuVenezuela, RBVietnamWest Bank and GazaWorldYemen, Rep.ZambiaZimbabwe Zeitlinie:
Diese Zeitleiste vorliegt die Graphik ab 1972 J. bis 2016 J. Germany. Die Angaben bis 1971 J. sind nicht vorhanden. Die Zahl aktueller Beobachtungen nach Daten: 45.
Die Quelle (Bezeichnung):
Kennzahlen der Weltentwicklung
Die Quelle (Einrichtung):
International Monetary Fund, Balance of Payments Statistics Yearbook and data files.
Kategorien:
Economy & Growth, External Debt, Trade
Es wurde aktualisiert:
23 Apr 2017 Jahr
Kennzahlen der Wertänderungen vom Jahr zum Jahr
im Durchschnitt:
661.88 Mlrd.
Minimum:
44.092 Mlrd.
1 Jan 1972 Jahr
Maximum:
1.713 Trln
1 Jan 2012 Jahr
Zum Datum der Beobachtung
Wert
Absolute Veränderung
Die Veränderung bezüglich dem vorherigen Wert
1 Jan 1972 Jahr
44.092 Mlrd.
+44.092 Mlrd.
0.0%
1 Jan 1973 Jahr
52.253 Mlrd.
+8.161 Mlrd.
18.51%
1 Jan 1974 Jahr
70.478 Mlrd.
+18.225 Mlrd.
34.88%
1 Jan 1975 Jahr
90.107 Mlrd.
+19.63 Mlrd.
27.85%
1 Jan 1976 Jahr
98.73 Mlrd.
+8.623 Mlrd.
9.57%
1 Jan 1977 Jahr
113.571 Mlrd.
+14.841 Mlrd.
15.03%
1 Jan 1978 Jahr
131.041 Mlrd.
+17.47 Mlrd.
15.38%
1 Jan 1979 Jahr
156.59 Mlrd.
+25.549 Mlrd.
19.5%
1 Jan 1980 Jahr
204.352 Mlrd.
+47.762 Mlrd.
30.5%
1 Jan 1981 Jahr
237.204 Mlrd.
+32.852 Mlrd.
16.08%
1 Jan 1982 Jahr
209.48 Mlrd.
-27.724 Mlrd.
-11.69%
1 Jan 1983 Jahr
200.12 Mlrd.
-9.36 Mlrd.
-4.47%
1 Jan 1984 Jahr
193.365 Mlrd.
-6.755 Mlrd.
-3.38%
1 Jan 1985 Jahr
190.031 Mlrd.
-3.334 Mlrd.
-1.72%
1 Jan 1986 Jahr
196.985 Mlrd.
+6.954 Mlrd.
3.66%
1 Jan 1987 Jahr
245.704 Mlrd.
+48.719 Mlrd.
24.73%
1 Jan 1988 Jahr
297.819 Mlrd.
+52.115 Mlrd.
21.21%
1 Jan 1989 Jahr
328.229 Mlrd.
+30.41 Mlrd.
10.21%
1 Jan 1990 Jahr
352.581 Mlrd.
+24.352 Mlrd.
7.42%
1 Jan 1991 Jahr
460.723 Mlrd.
+108.142 Mlrd.
30.67%
1 Jan 1992 Jahr
516.325 Mlrd.
+55.602 Mlrd.
12.07%
1 Jan 1993 Jahr
554.728 Mlrd.
+38.403 Mlrd.
7.44%
1 Jan 1994 Jahr
491.847 Mlrd.
-62.881 Mlrd.
-11.34%
1 Jan 1995 Jahr
543.21 Mlrd.
+51.363 Mlrd.
10.44%
1 Jan 1996 Jahr
655.063 Mlrd.
+111.854 Mlrd.
20.59%
1 Jan 1997 Jahr
646.798 Mlrd.
-8.265 Mlrd.
-1.26%
1 Jan 1998 Jahr
631.965 Mlrd.
-14.833 Mlrd.
-2.29%
1 Jan 1999 Jahr
668.885 Mlrd.
+36.921 Mlrd.
5.84%
1 Jan 2000 Jahr
694.575 Mlrd.
+25.69 Mlrd.
3.84%
1 Jan 2001 Jahr
717.729 Mlrd.
+23.154 Mlrd.
3.33%
1 Jan 2002 Jahr
697.355 Mlrd.
-20.374 Mlrd.
-2.84%
1 Jan 2003 Jahr
714.692 Mlrd.
+17.338 Mlrd.
2.49%
1 Jan 2004 Jahr
874.002 Mlrd.
+159.309 Mlrd.
22.29%
1 Jan 2005 Jahr
1.014 Trln
+140.195 Mlrd.
16.04%
1 Jan 2006 Jahr
1.116 Trln
+101.886 Mlrd.
10.05%
1 Jan 2007 Jahr
1.29 Trln
+173.505 Mlrd.
15.55%
1 Jan 2008 Jahr
1.54 Trln
+249.933 Mlrd.
19.38%
1 Jan 2009 Jahr
1.67 Trln
+130.122 Mlrd.
8.45%
1 Jan 2010 Jahr
1.305 Trln
-364.775 Mlrd.
-21.85%
1 Jan 2011 Jahr
1.463 Trln
+158.383 Mlrd.
12.14%
1 Jan 2012 Jahr
1.713 Trln
+249.515 Mlrd.
17.05%
1 Jan 2013 Jahr
1.592 Trln
-120.342 Mlrd.
-7.03%
1 Jan 2014 Jahr
1.65 Trln
+57.809 Mlrd.
3.63%
1 Jan 2015 Jahr
1.69 Trln
+39.801 Mlrd.
2.41%
1 Jan 2016 Jahr
1.461 Trln
-228.648 Mlrd.
-13.53%
Bewertung der Länder gemäß mit laufender Statistik nach Jahren


Kommentare: